The Human Resources: Absences area provides graphs that can be used to help you analyse your employee’s individual attendance over the course of their working year, allowing you to gain oversight of the number and frequency of their absences. This can help you to identify any concerns within their individual attendance, and to respond accordingly. Note that these graphs only include entries within the employees’ Absence Record: they will not include holiday data.
Two graphs are available:
To view an individual employee’s graphs, open their record on its Absences tab (see View an Employee’s Absence Record) and click on the appropriate button. By default, each graph will display data from the past twelve months, but you can alter this date range using the filters at the top of the page. In addition, Activ also allows you to extract the graphs and their underlying raw data from your system using the two buttons at the bottom of each page:
- Save As Image, which generates a copy of the graph that can be saved to your computer.
- Export, which downloads a CSV file of the data to enable you to perform your own analysis.
*****
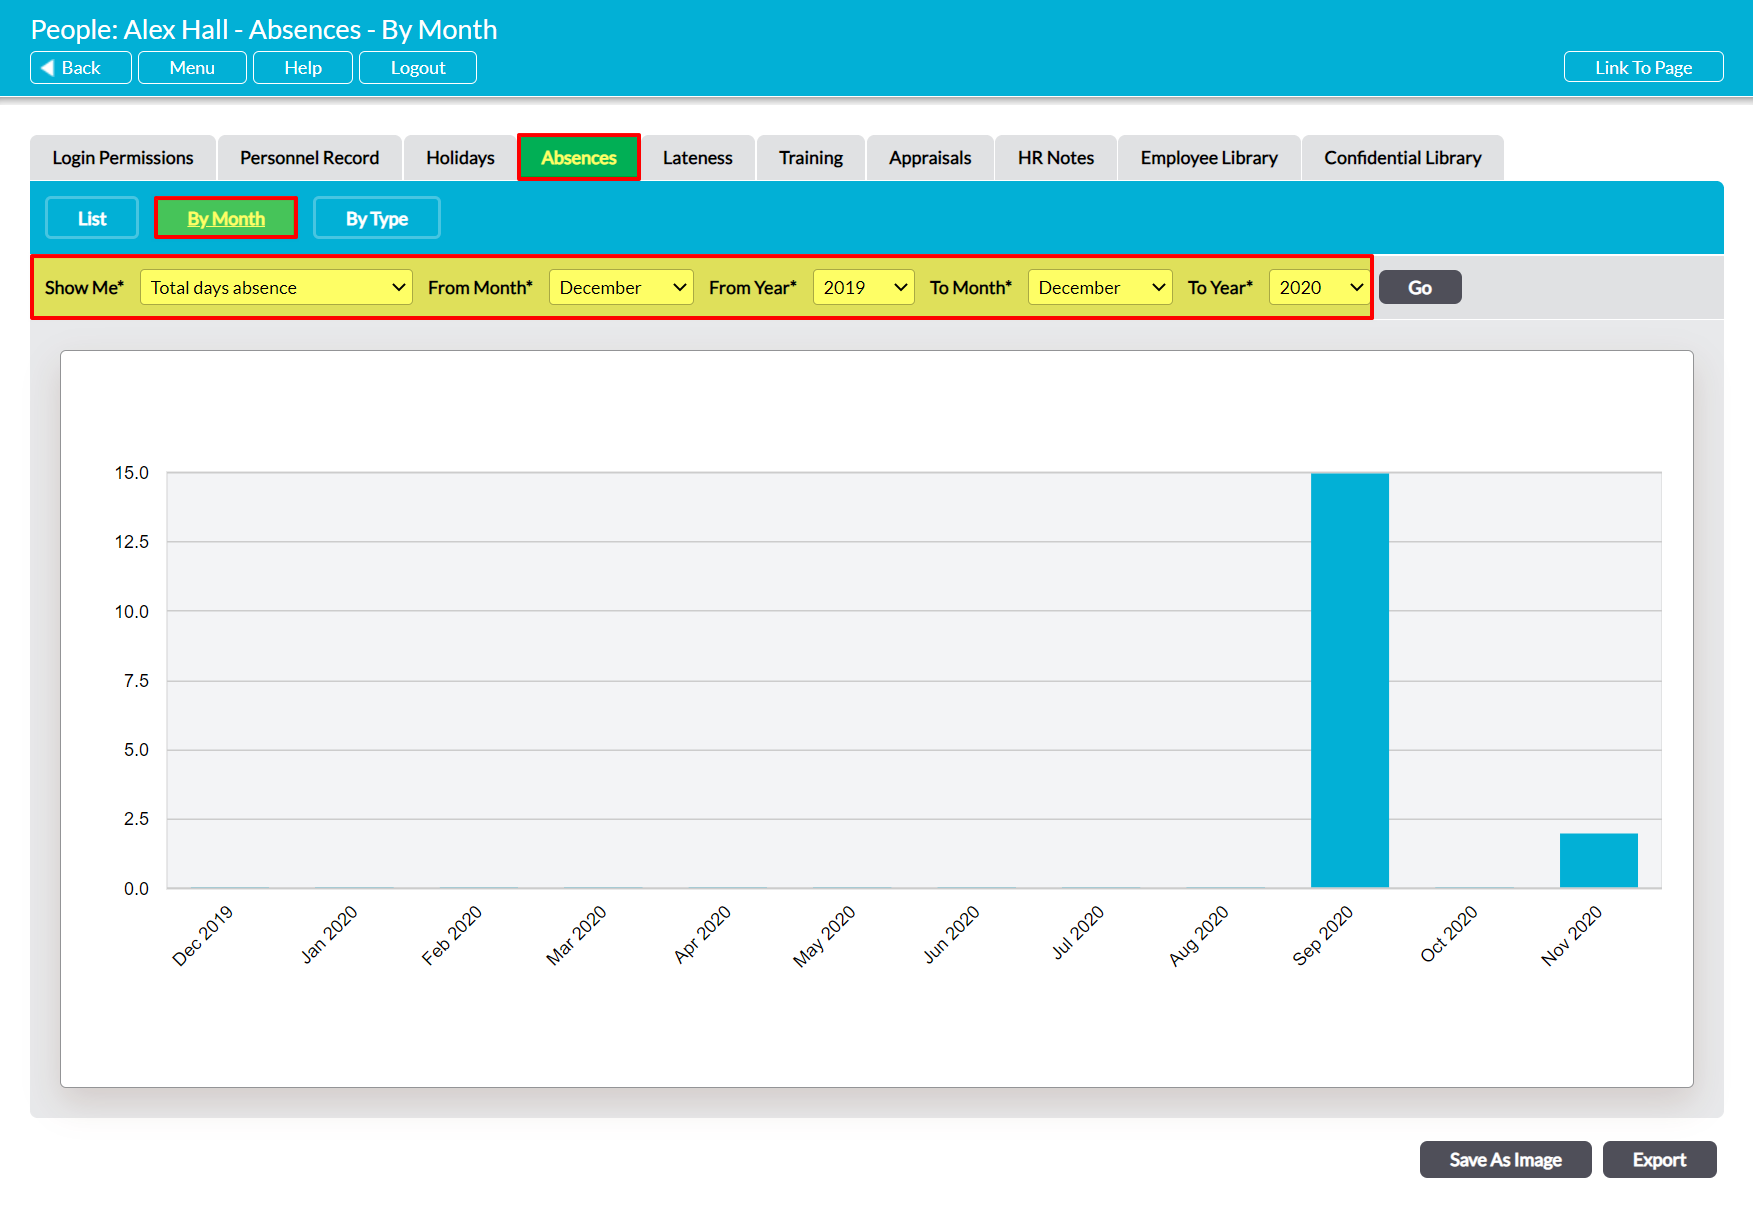
By Month
To view this graph, open the employee’s Absence Record and click on the By Month button at the top of the screen. Activ will provide you with a visual summary of the employee’s absence data for each month within the selected date range.
If necessary, you can use the Show Me* filter at the top of the page to switch between:
- Total days absence – the default option. This will display the number of days that the employee was absent for during the course of each month (e.g. if the employee has two periods of absence during January and each lasted for five days, January will display a total of ‘10’).
- Number of absences – this will display the number of absence periods that were recorded against the employee during the course of each month (e.g. if the employee has two periods of absence during January, January will display a total of ‘2’ regardless of how long those absences lasted).
*****
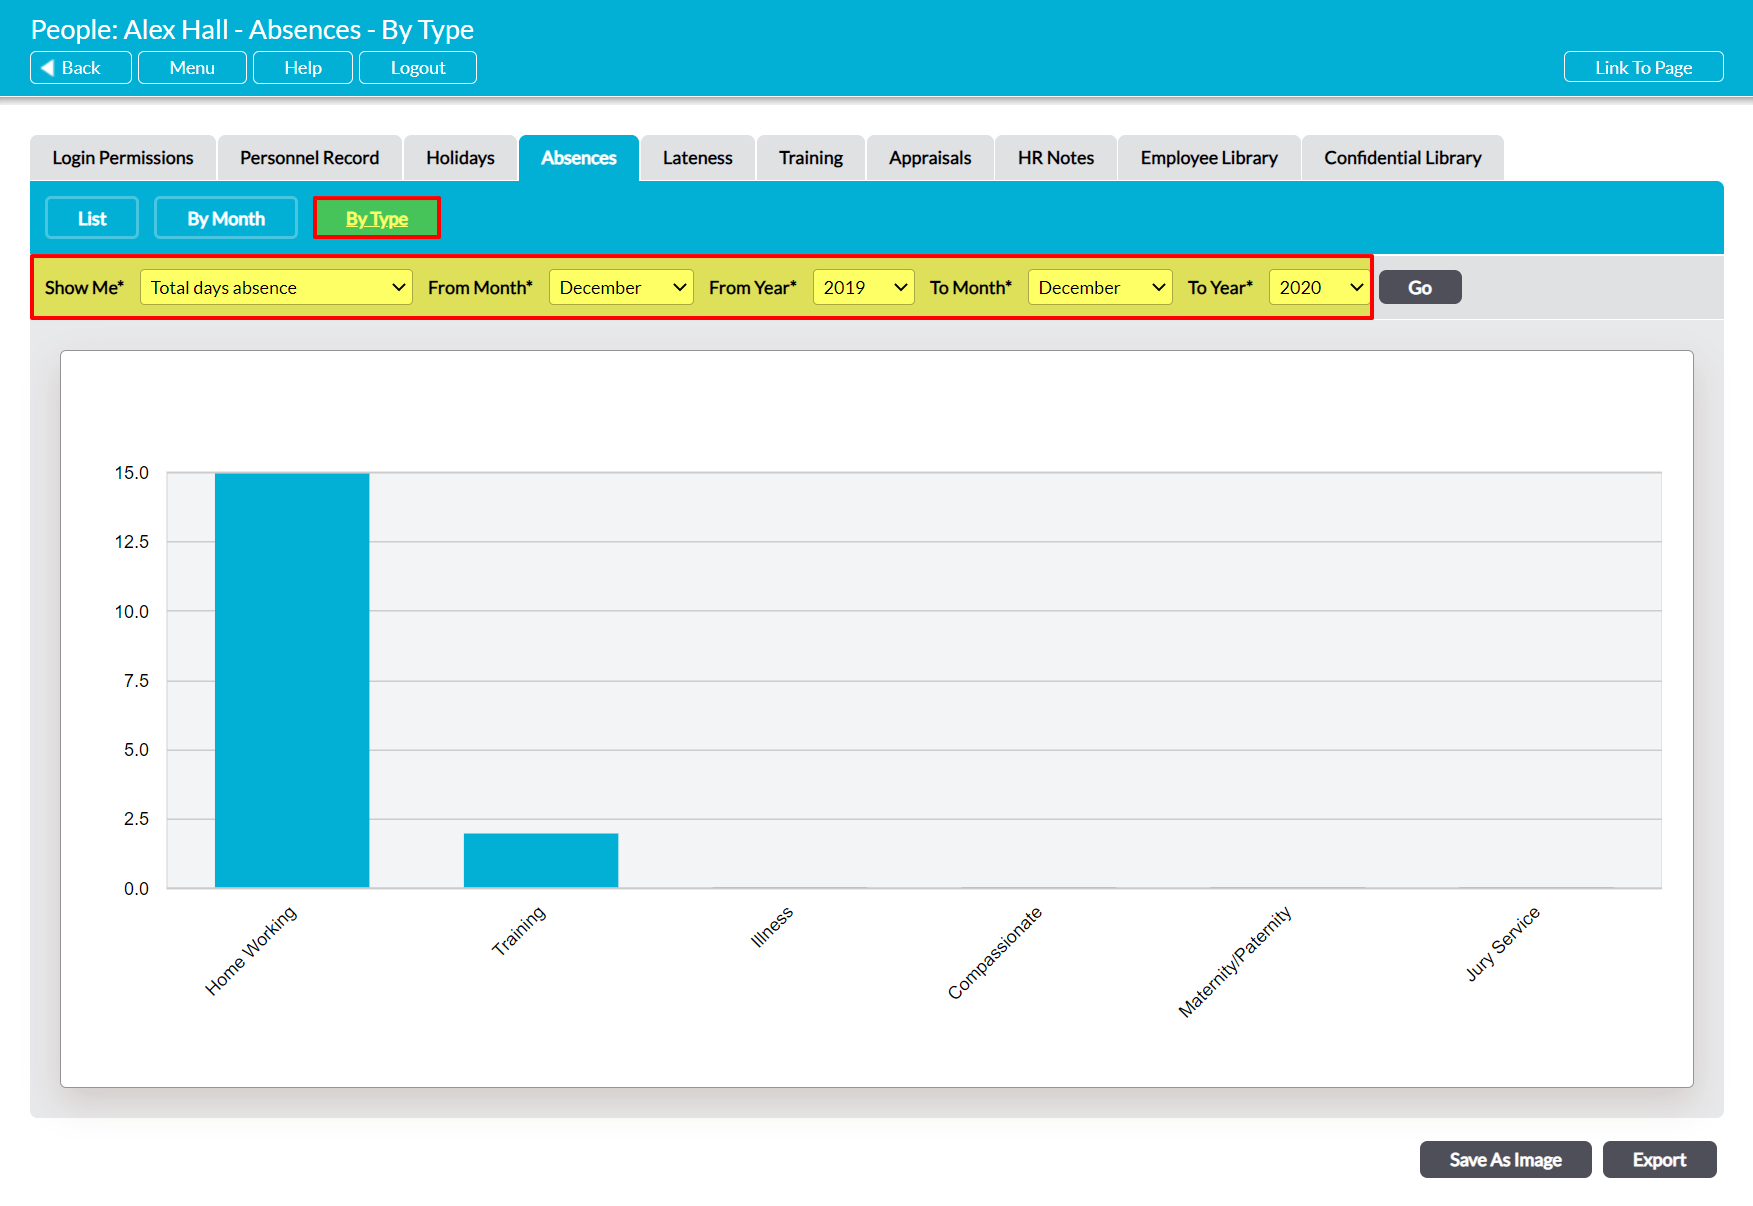
By Type
To view this graph, open the employee’s record and click on the By Type button at the top of the page. Activ will provide you with a visual summary of the employee’s absence data for each type of absence that is currently recorded within your system. Note that you can customise these absence types from the module’s Settings tab if necessary (see Configure Holidays, Lateness, and Absences).
If necessary, you can use the Show Me* filter at the top of the page to switch between:
- Total days absence – the default option. This will display the number of days of absence that have been recorded against each absence type (e.g. if the employee has two five-day periods of absence recorded as ‘Illness’ and one five-day period recorded as ‘Training’, Illness will display a total of ‘10’, and Training a total of ‘5’).
- Number of absences – this will display the number of absence periods that were recorded against each absence type (e.g. if the employee has two periods of absence recorded as ‘Illness’, and one period recorded as ‘Training’, Illness will display a total of ‘2’ and Training a total of ‘1’ regardless of how long those absences lasted.)