The Human Resources: Absences area provides a set of graphs and reports that can be used to support company-level absence monitoring and analysis, allowing you to gain oversight of overall attendance levels and to identify company and team (if you have the Teams module) trends. Note that these graphs and reports will only include entries within your employees’ Absence Records: they will not include holiday data.
Two reports are available:
In addition, two graphs are available:
To view your company’s graphs and reports, open the Human Resources module and click on the Absences tab, then select the appropriate button at the top of the screen. By default, each graph and report will display data from the past twelve months, but you can use the filters at the top of the screen to alter this date range for all options except the Bradford Factor Analysis. In addition, Activ also allows you to extract the graphs and their underlying raw data from your system using the two buttons at the bottom of each graph’s page:
- Save As Image, which generates a copy of the graph that can be saved to your computer.
- Export, which downloads a CSV file of the data to enable you to perform your own analysis.
If necessary, you can also extract the raw Bradford Factor data from your system by clicking on the Export button at the bottom of the Bradford Factor report.
*****
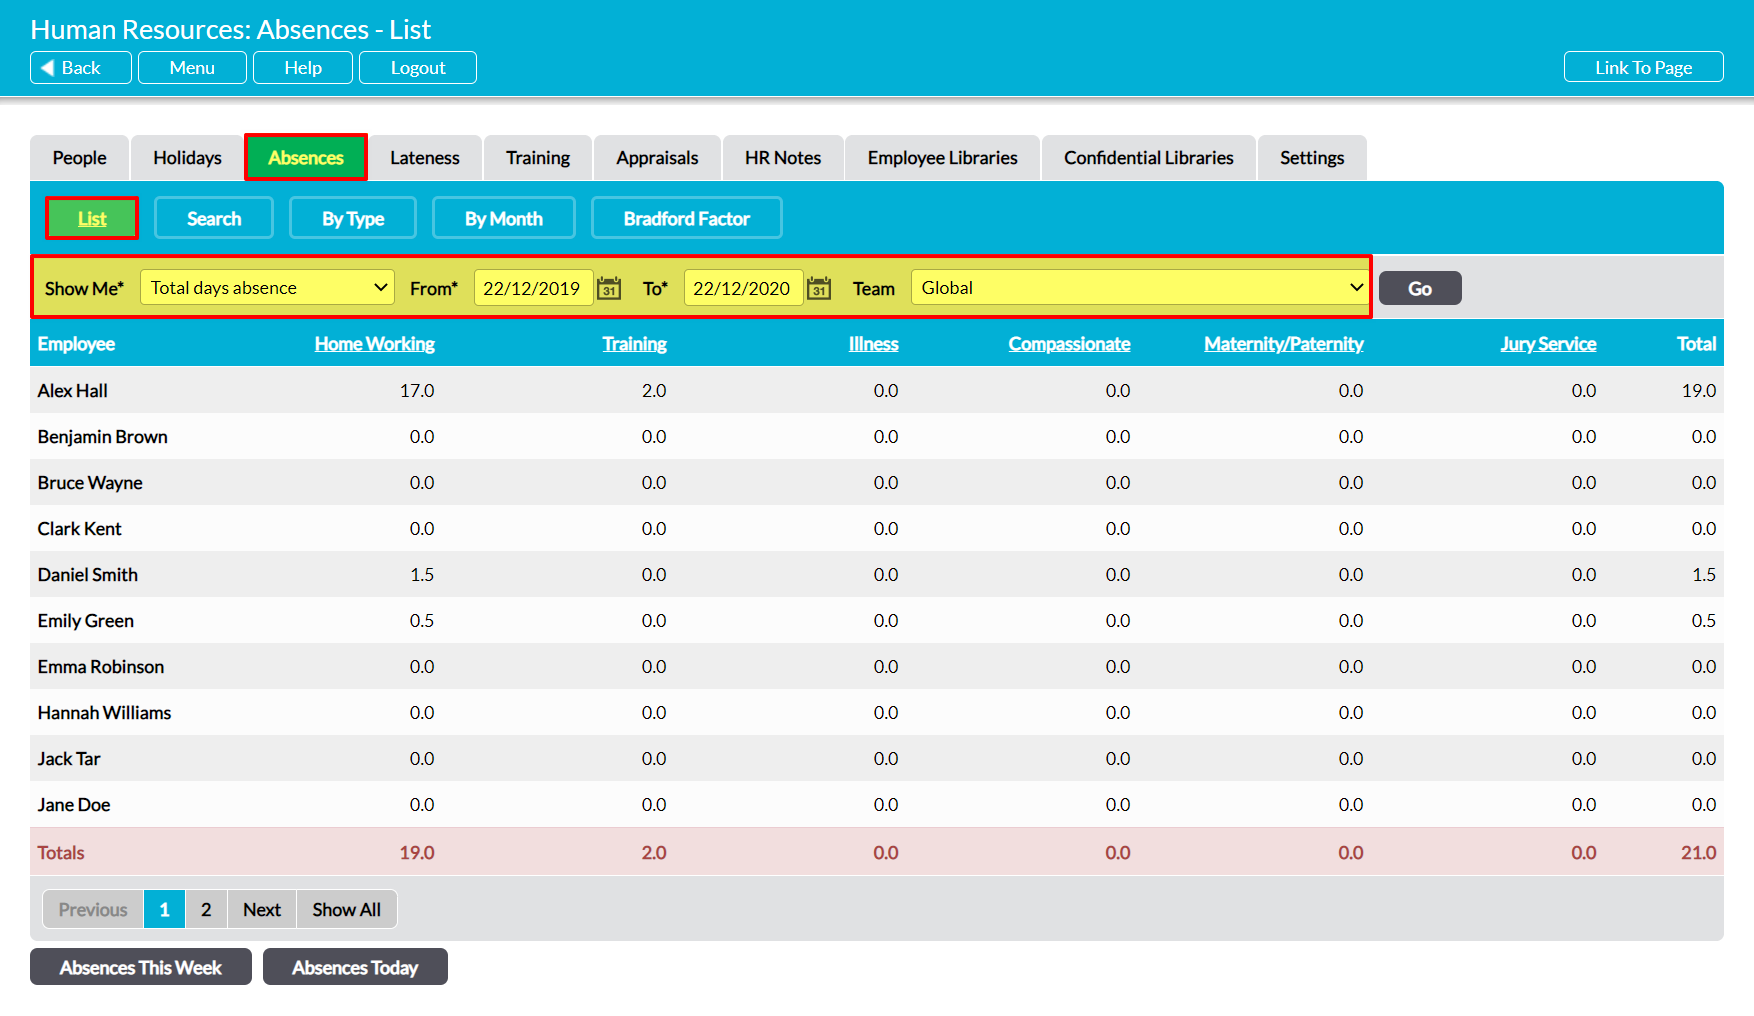
List Report
The Absences tab will automatically open on the List section, which contains this report. The page will display a list of all employees that are recorded within your system, and provides a summary of individual and overall absences by absence type. By default it will include all employees within your company, but if your package includes the Teams module then you will also be able to analyse individual Team data using the filters at the top of the screen.
If necessary, you can use the Show Me* filter at the top of the page to switch between:
- Total days absence – the default option. This will display the number of days that each employee has been absent for during the course of each month (e.g. if the employee has two five-day periods of absence recorded as ‘Illness’ and one five-day period recorded as ‘Training’, Illness will display a total of ’10’, and Training a total of ‘5’).
- Number of absences – this will display the number of absence periods that were recorded against each absence type (e.g. if the employee has two periods of absence recorded as ‘Illness’, and one period recorded as ‘Training’, Illness will display a total of ‘2’ and Training a total of ‘1’ regardless of how long those absences lasted.)
*****
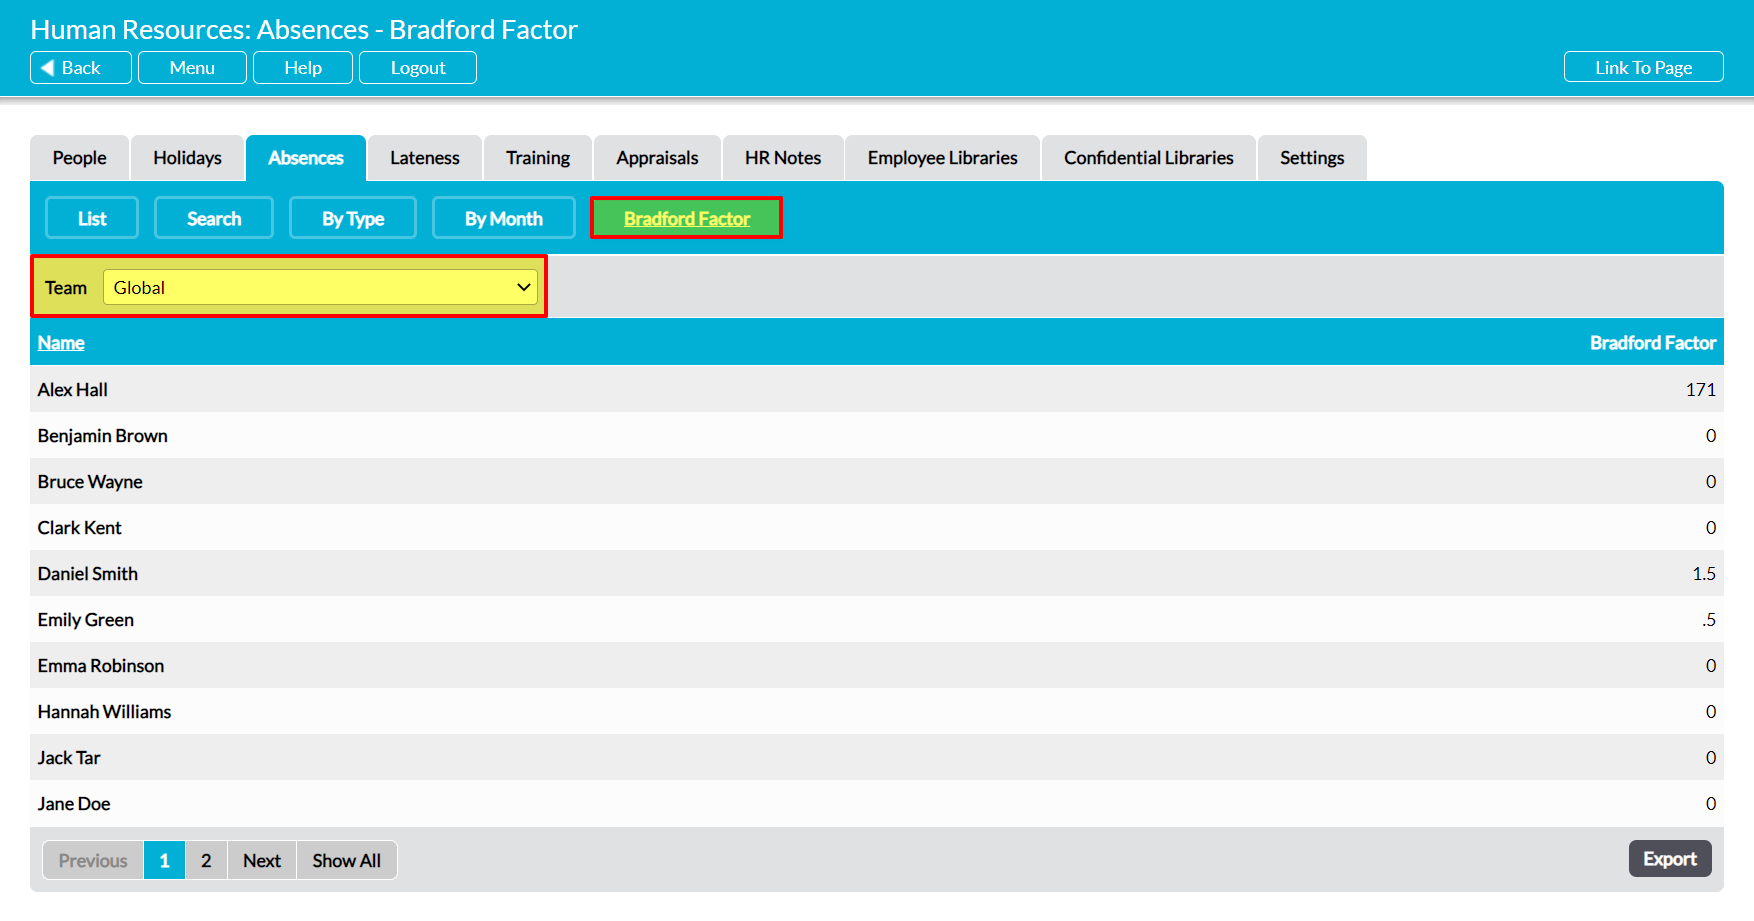
Bradford Factor Report
To view this report, open the Absences tab and click on the Bradford Factor button at the top of the screen. Activ will provide you with a list of all employees that are recorded within your system, and a record of their current Bradford Factor statistic. This statistic is a standardised measure that you can use to monitor unplanned and unauthorised absence, and is automatically calculated using the following formula:
Bradford Factor = (total number of absence episodes)2 x total number of days absent
By default, Activ will include all absences within this calculation, meaning that the statistic will be drawn from both ‘authorised’ (e.g. maternity leave) and ‘unauthorised’ (e.g. illness) absence types. This may result in skewed statistics for your employees, so care should be taken to ensure that ‘authorised’ forms of absence, such as maternity leave or jury service, are set to be excluded from the calculations.
Activ allows you to customise which absence types should and should not be included within Bradford Factor calculations. To exclude a given absence type from the calculations, you will need to switch the Include in Bradford Factor? option to ‘No’ from within the absence type’s Settings (see Configure Holidays, Lateness, and Absences).
*****
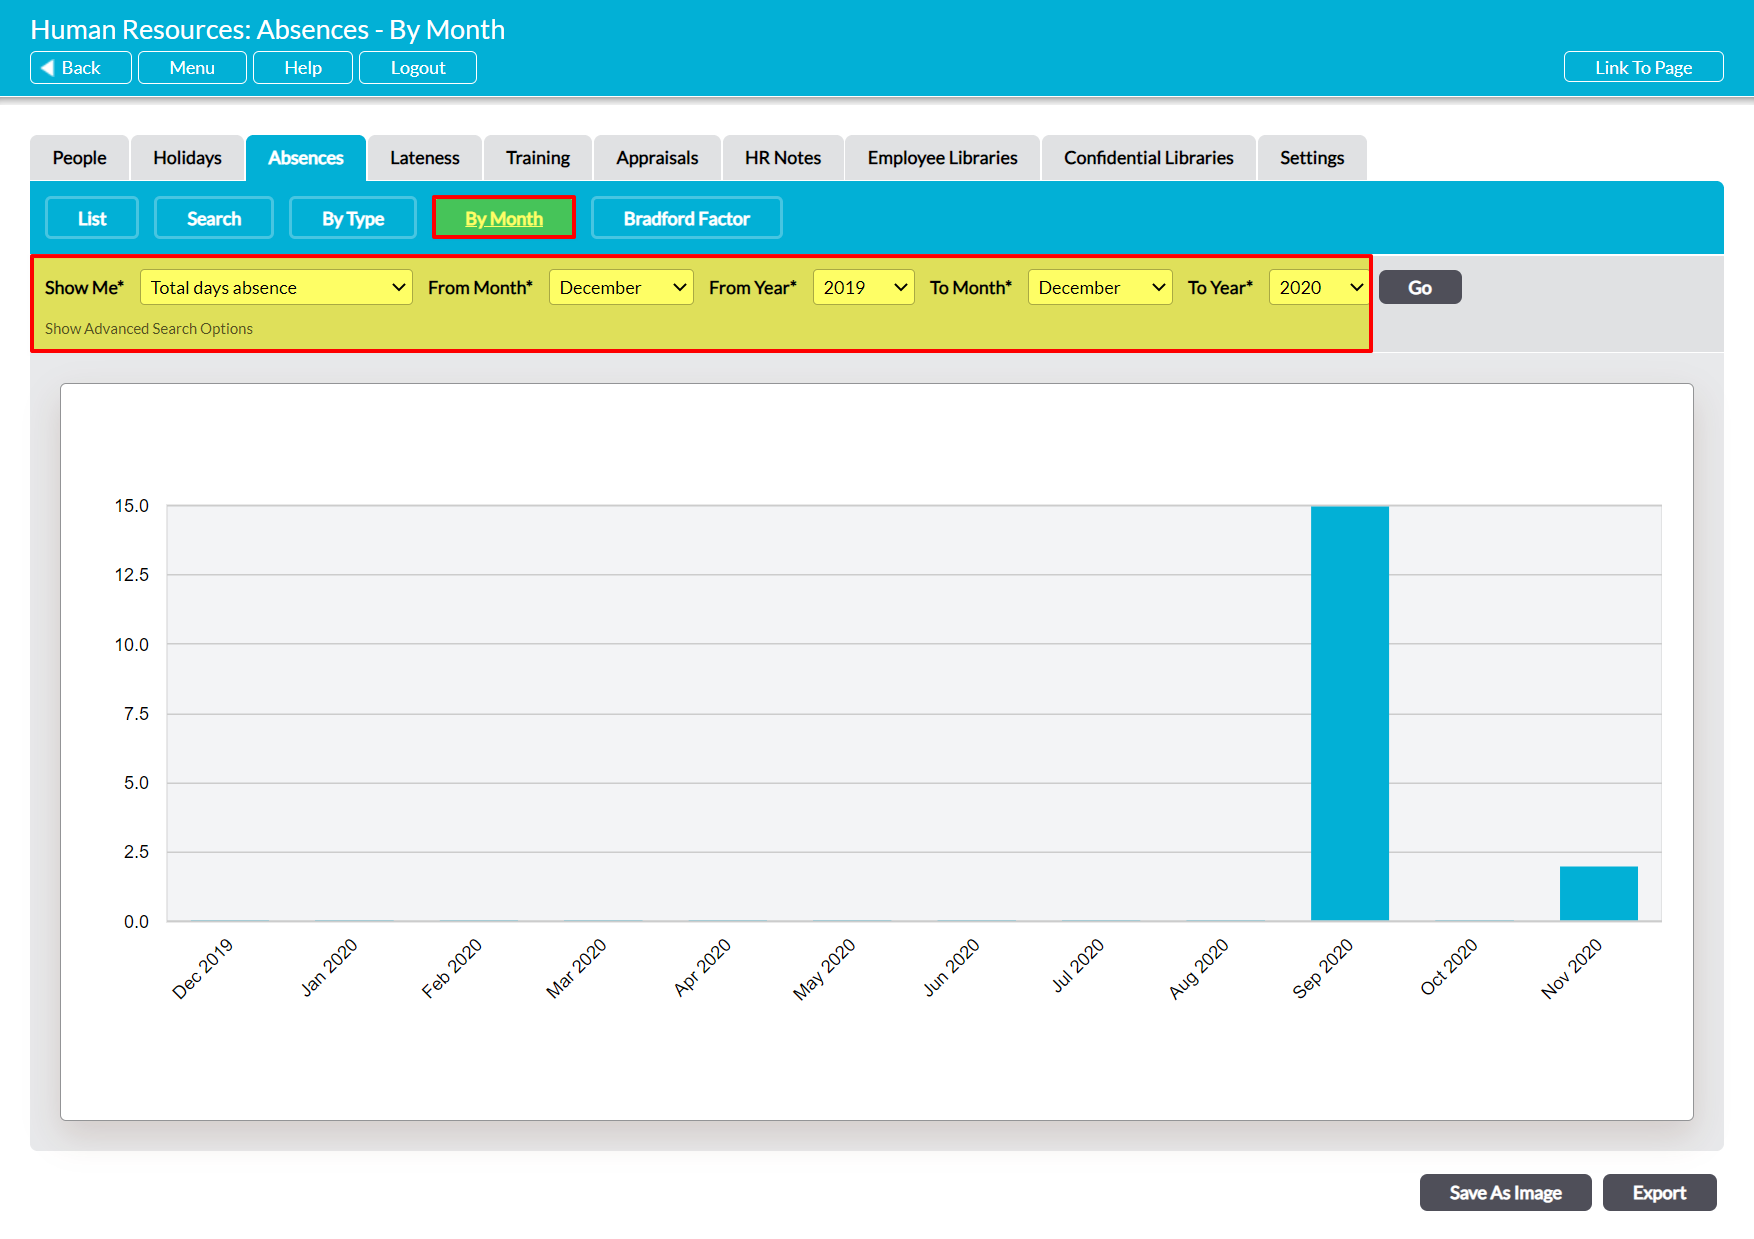
By Month Graph
To view this graph, open the Absences tab and click on the By Month button at the top of the screen. Activ will provide you with a visual summary of the company’s absence data for each month within the selected date range.
If necessary, you can use the Show Me* filter at the top of the page to switch between:
- Total days absence – the default option. This will display the number of days that employees have been absent for during the course of each month (e.g. if two employees had a five-day absence period during January, January will display a total of ‘10’).
- Number of absences – this will display the number of absence periods that were recorded during the course of each month (e.g. if two employees had two periods of absence during January, January will display a total of ‘4’).
*****
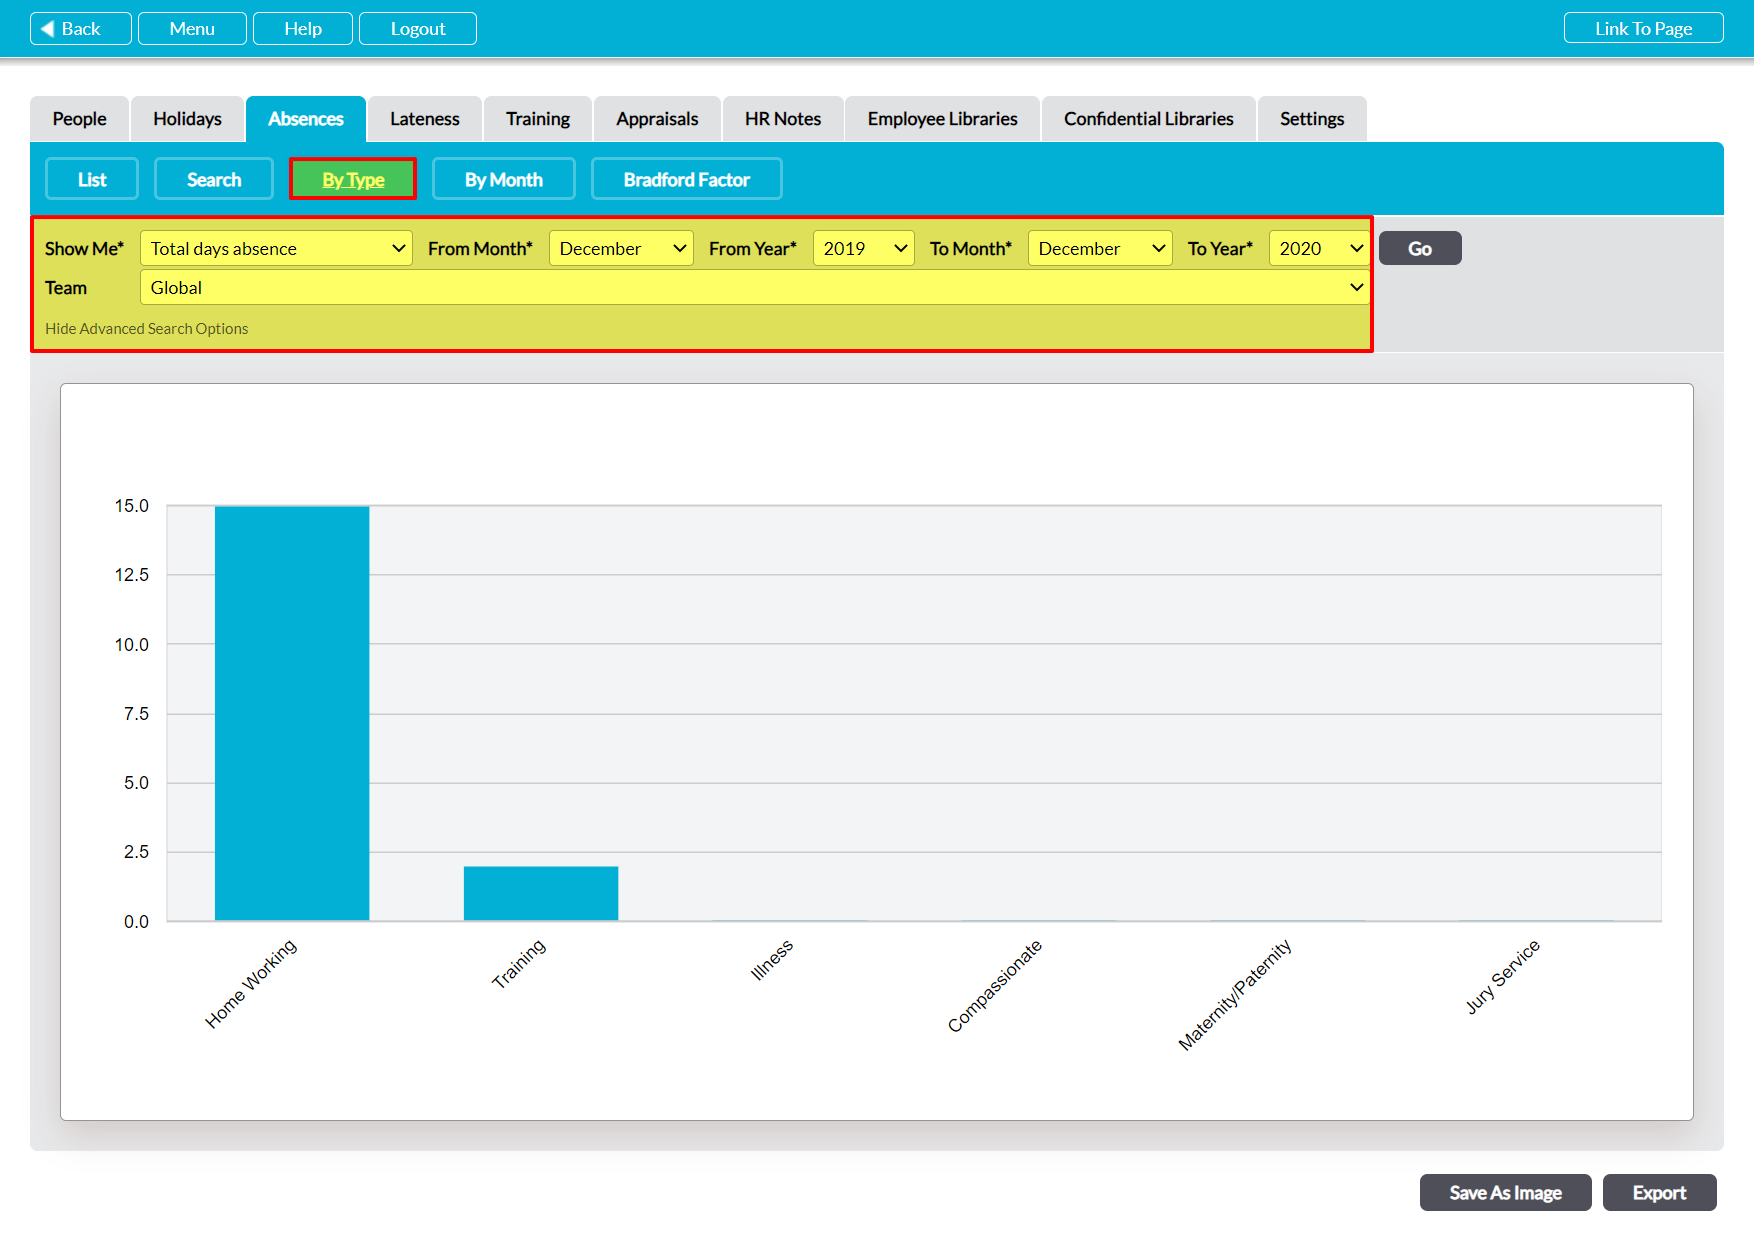
By Type Graph
To view this graph, open the Absences tab and click on the By Type button at the top of the page. Activ will provide you with a visual summary of the company’s absence data for each type of absence that is currently recorded within your system. Note that you can customise these absence types from the module’s Settings tab if necessary (see Configure Holidays, Lateness, and Absences).
If necessary, you can use the Show Me* filter at the top of the page to switch between:
- Total days absence – the default option. This will display the number of days of absence that have been recorded against each absence type (e.g. if two five-day periods of absence have been recorded as ‘Illness’ and one five-day period as ‘Training’, Illness will display a total of ’10’, and Training a total of ‘5’).
- Number of absences – this will display the number of absence periods that were recorded against each absence type (e.g. if two periods of absence were recorded as ‘Illness’ and one period as ‘Training’, Illness will display a total of ‘2’ and Training a total of ‘1’).