Activ provides a System Usage chart to enable you to ensure that your system is being utilised at the expected frequency, and help you to identify whether additional steps need to be taken to encourage your staff to incorporate Activ into their work processes. This may be of particular use when you first obtain Activ and need to monitor staff buy-in, or in the run up to Audits, when you need to ensure that your system is being appropriately maintained.
To view your system usage levels, open the System Administration module on its Usage tab and click on the Usage Levels button at the top of the screen. Activ will provide you with a visual summary of weekly page hits, allowing you to determine how much your system is currently being used.
Note that the Usage Chart displays the total number of page hits made by all users within your system, and that weekly figures are updated at midnight each day. It includes data from the past thirteen weeks (including the current week), and records the total number of:
- Page and tab views.
- Item views (e.g. three hits would be gained from opening an Improvement Log, viewing its Links, and then viewing its History).
- Button and link clicks, if that button/link opens a new page within Activ (e.g. clicking the Back button counts as one hit; clicking Total Open in the Improvement Log Dashboard counts as one hit; editing and saving an item counts as two hits, etc).
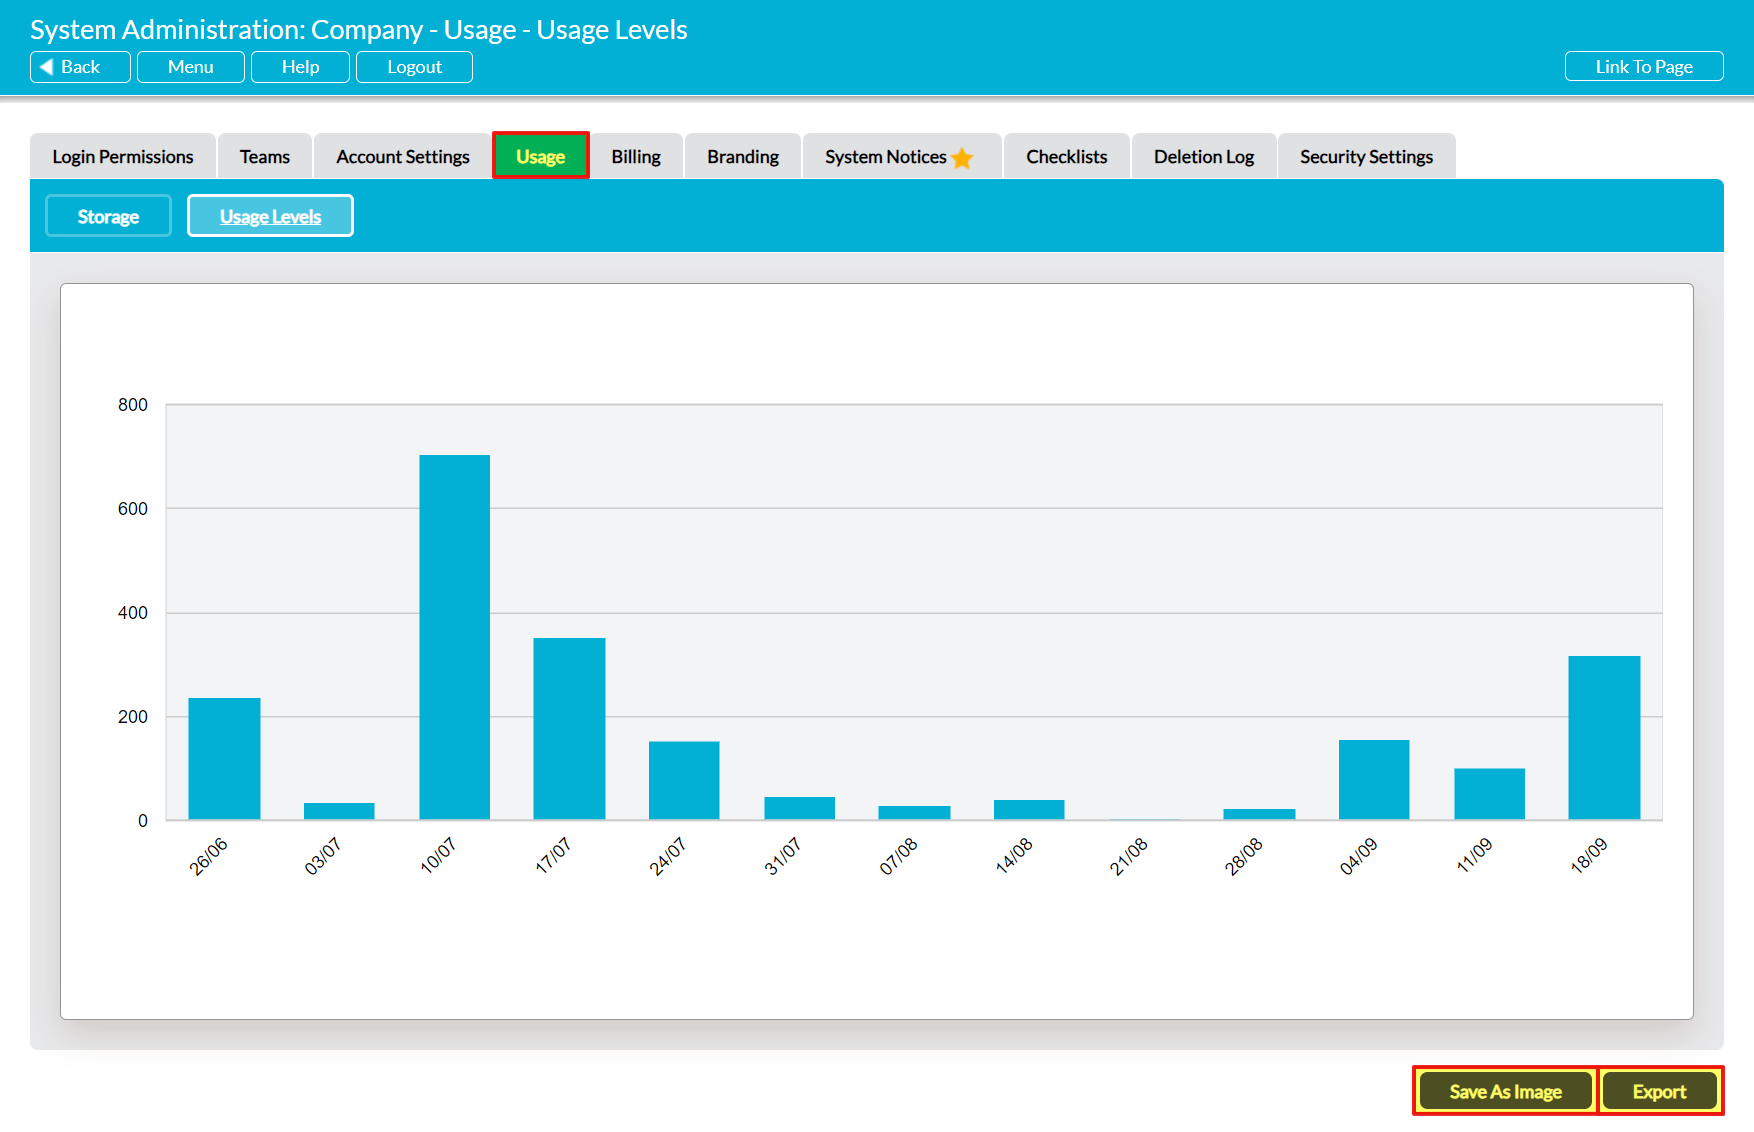
It is not possible to customise this graph. However, Activ provides you with the option to extract the graph and its underlying raw data from your system using the two buttons at the bottom of the page:
- Save As Image, which generates a copy of the graph that can be saved to your computer.
- Export, which downloads a CSV of the data to enable you to perform your own analysis.
