Activ allows you to view a summary of your storage usage at any time, enabling you to track your current costs, how much storage you are currently using, and where your storage is being used. This information is provided to help you identify the types of data that are currently within your system, and to gain oversight of when your storage allowance, and thus costs, may need to be increased.
The following types of data are included when calculating your system’s current storage:
- All files that are stored within your Libraries (i.e. Records, Controlled Documents, Company Files, Employee Libraries, Confidential Libraries). This includes both current and previous versions of each file.
- All files that are attached to your Improvement Logs, Legal Assessments, etc
- All photographs that are attached or uploaded to your Incident Logs, Audits, etc
Items such as Processes, Legal Assessments, and individual Improvement Logs are saved directly to the database, and do not impact your storage usage or costs.
*****
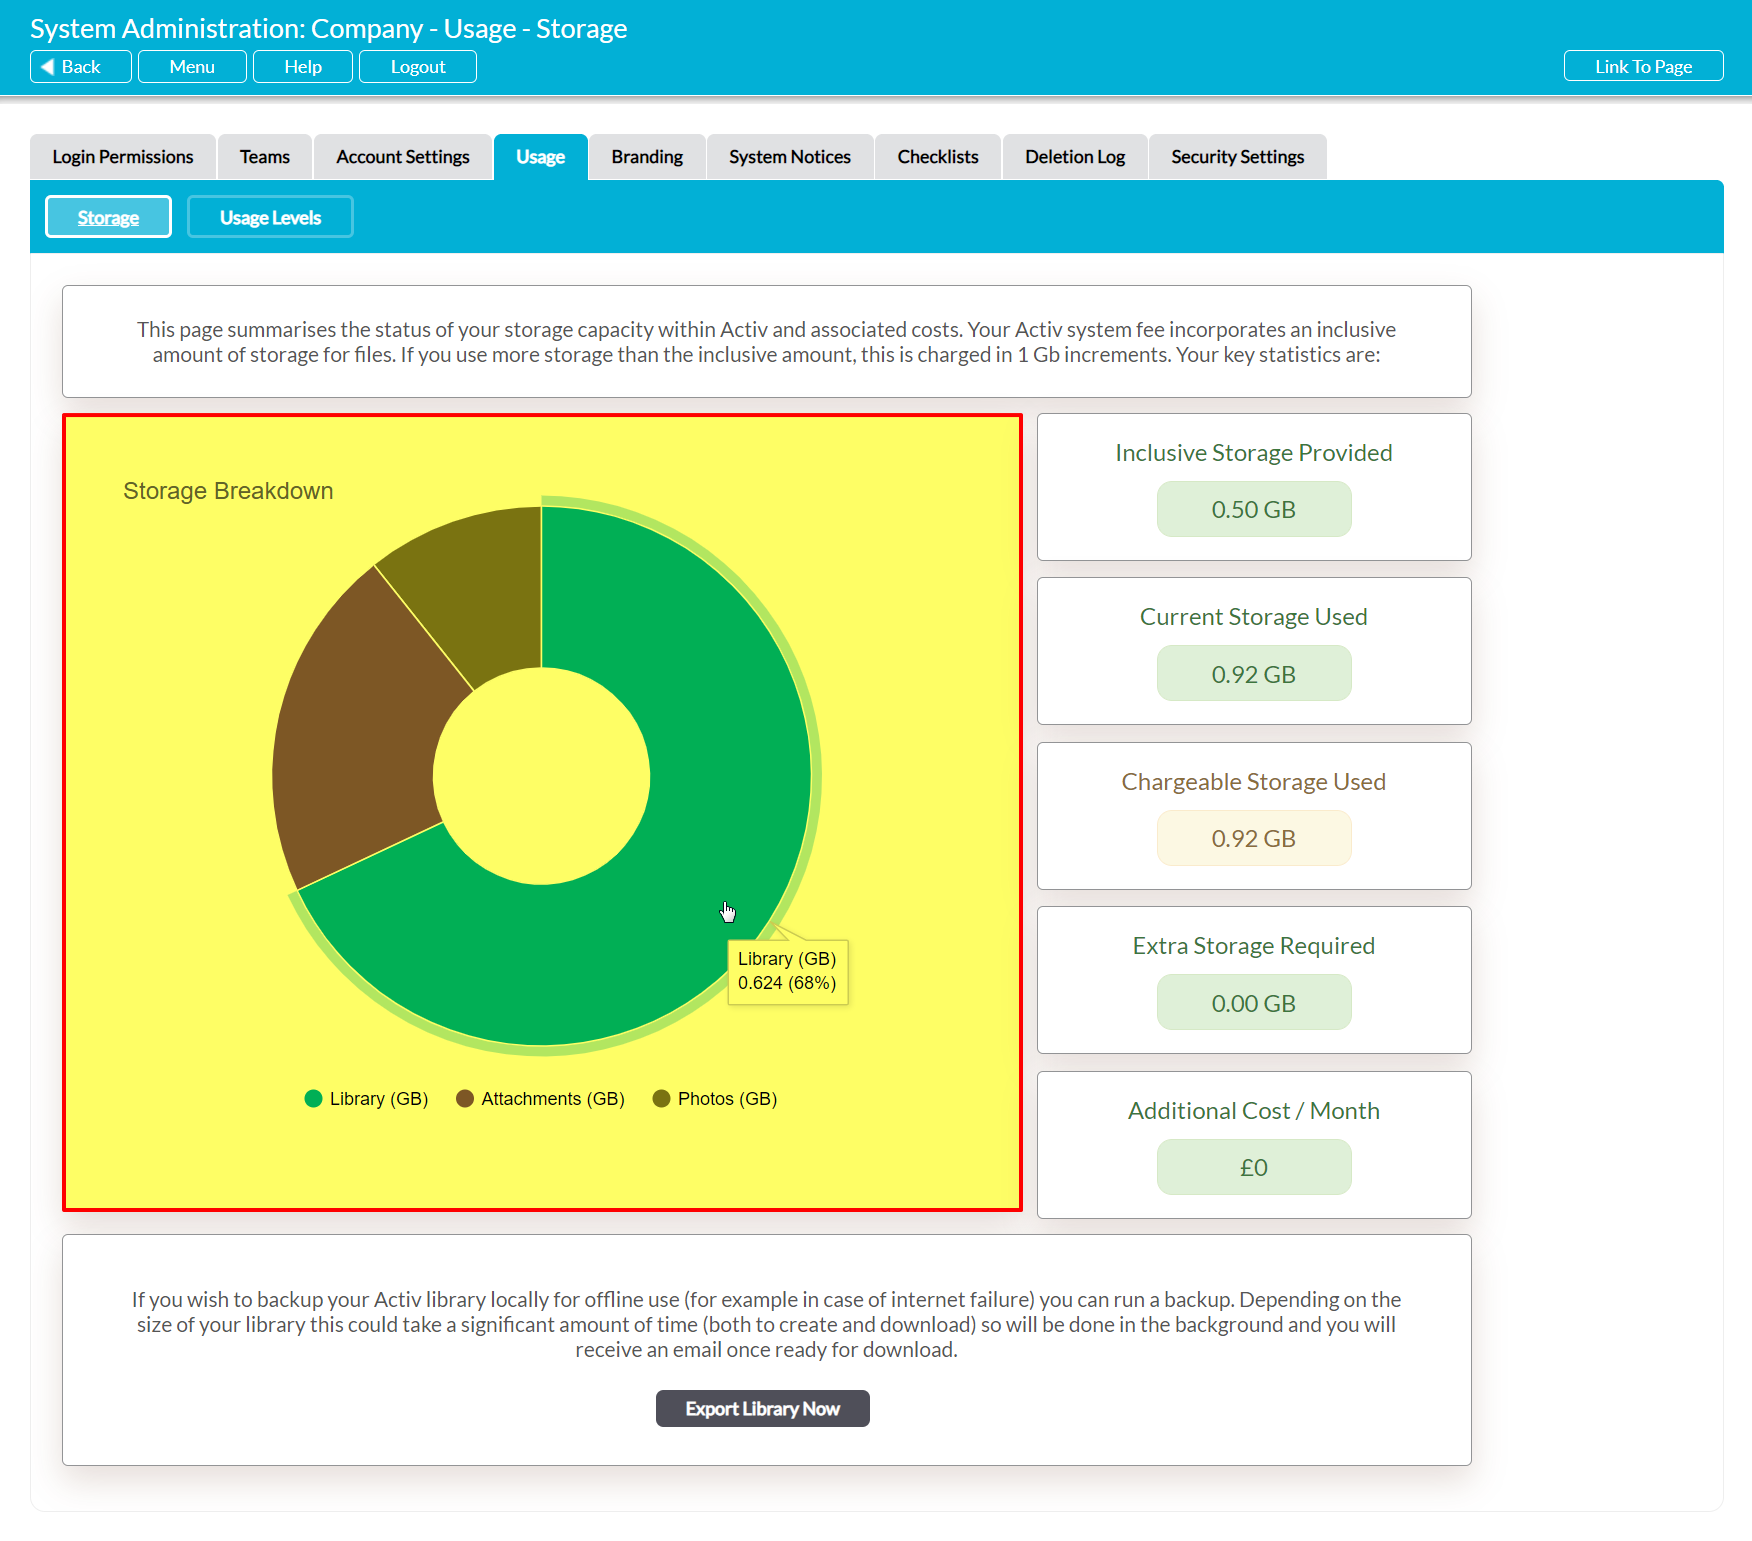
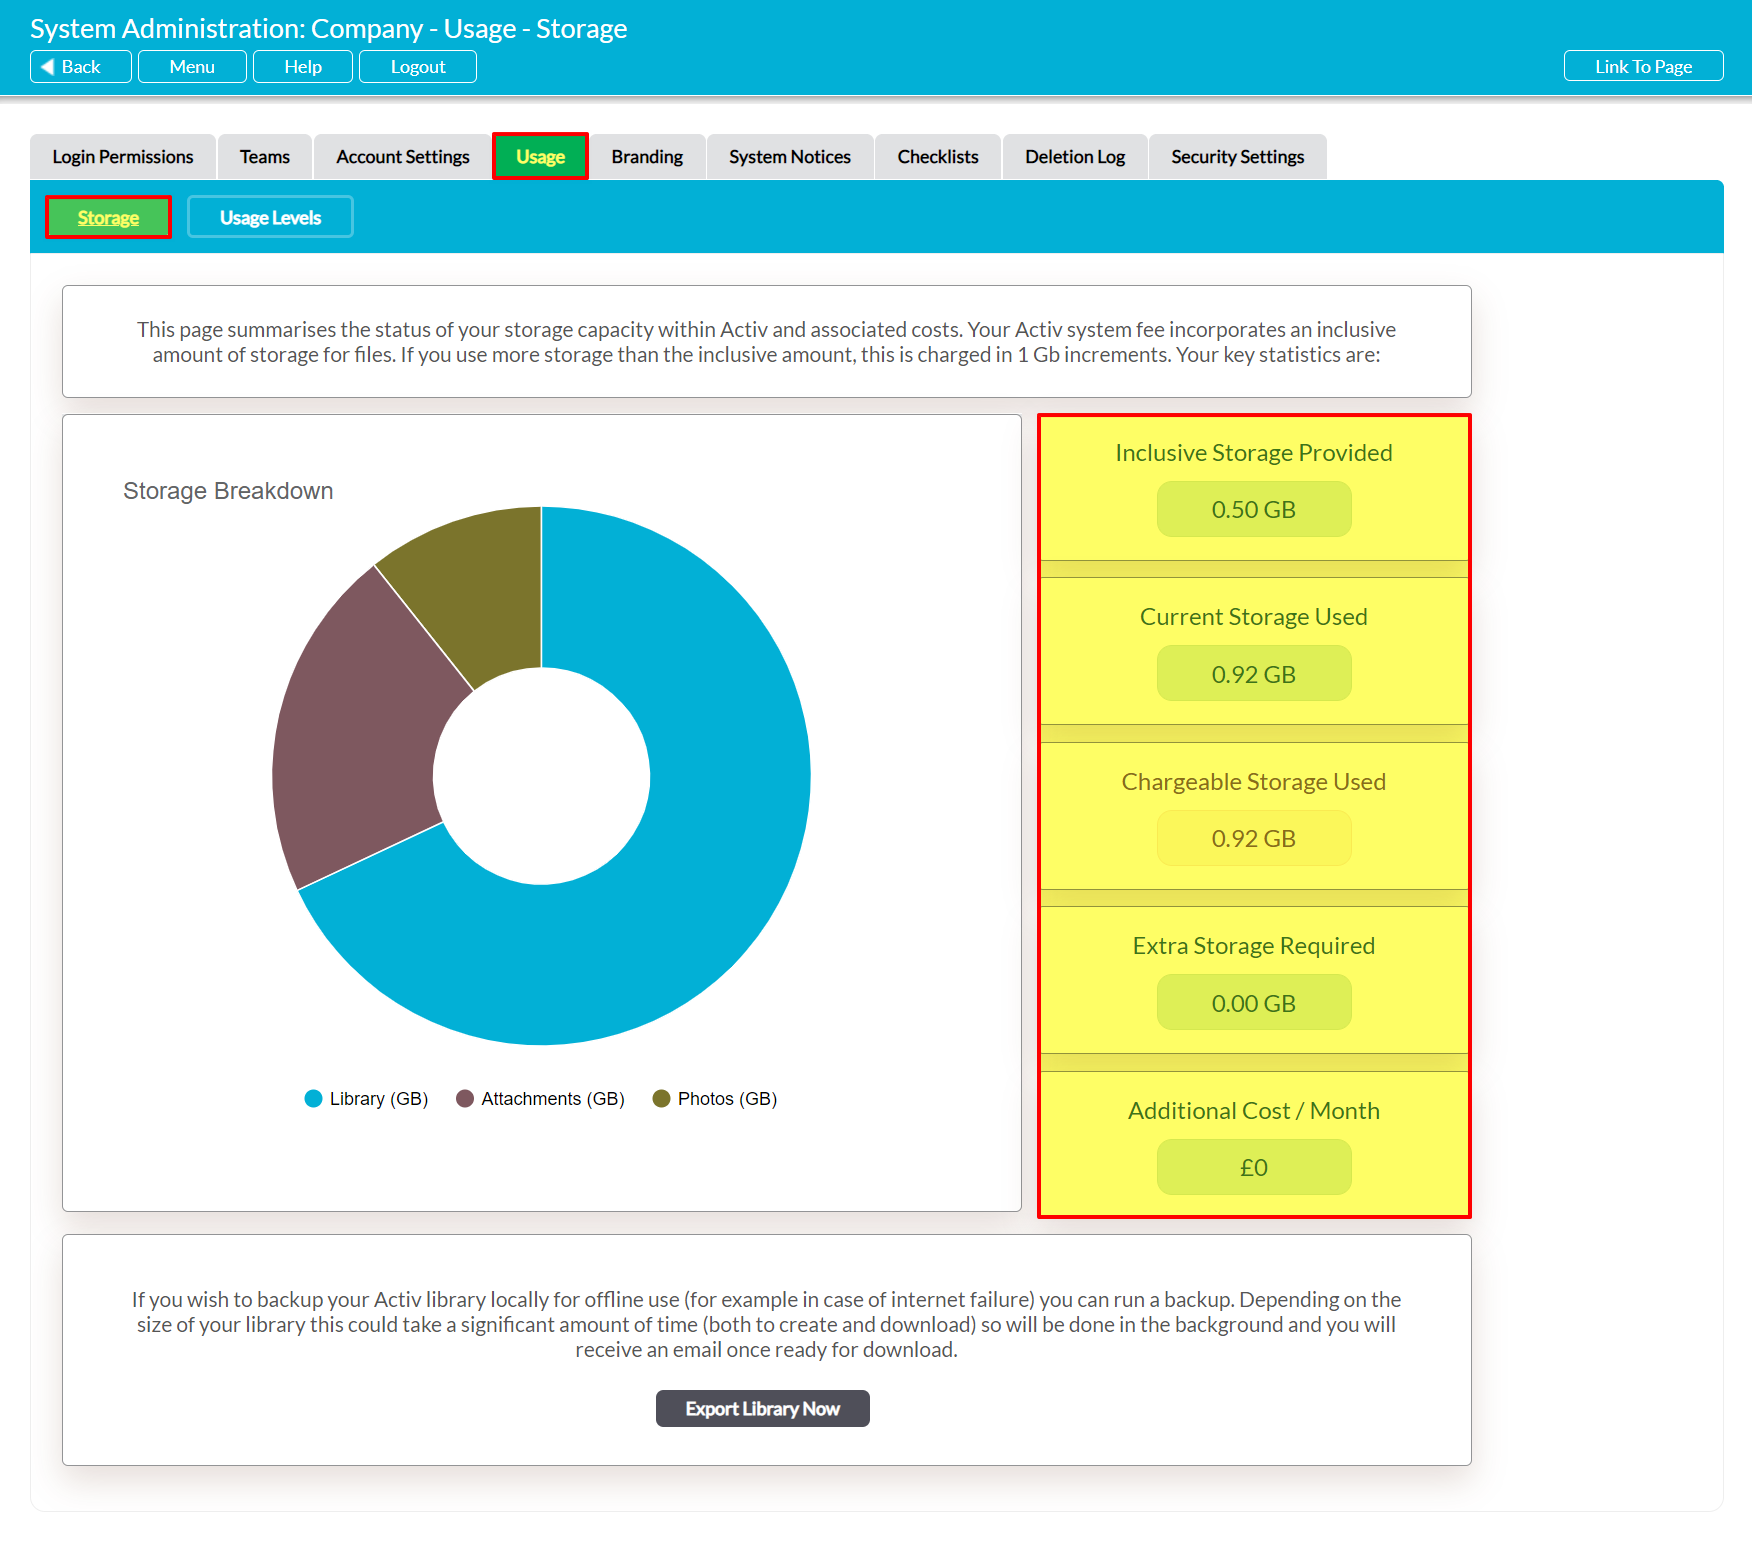
To view your current storage usage and costs, open the System Administration module and click on the Usage tab. Activ will automatically open on its Storage page, which summarises the information pertaining to your system’s storage levels. Note that all storage figures within these panels are rounded to two decimal places, representing the number of megabytes (MB) currently in use (e.g. 0.90 Gigabytes (GB) is equivalent to 900 MB).
A column of five panels will be displayed on the right side of your screen. These provide the key figures relating to your storage, which are:
Inclusive Storage Provided – this displays your inclusive (base) storage – i.e. the amount of storage that is included within your system’s base price. Inclusive storage varies depending on your initial package, but is typically between 2 and 10 GB.
Current Storage Used – this displays the total amount of storage your system is currently using (see above for storage-using items). This figure will increase as you store more files/photos/attachments within your system, and will fall if you compress files or remove photos or attachments.
Chargeable Storage Used – this displays the total amount of used storage that you are currently being charged for. It includes both your inclusive storage and any additional storage that you are currently using. Typically, this figure will match Current Storage Used, but it may display a lower figure if you were provided with a deal on storage when you initially signed up for Activ.
Extra Storage Required – this figure displays any additional storage space that has been purchased for your system, and is provided to enable you to track how much non-inclusive storage you are currently being invoiced for. Extra storage is provided and charged for in 1 GB increments, and you will automatically be warned if an upload will increase your Extra Storage requirements.
Additional Cost / Month (or Year) – this figure displays the total cost of any additional storage space that has been purchased for your system. This value will be calculated on either a monthly or yearly basis (depending on the payment schedule agreed for your system) and will be displayed on your Activ invoices. Activ will automatically warn you if an upload will increase your storage requirements, and you will be prompted to accept the additional cost before new files are added to your system.
For convenience, your Storage page will also include an automatically generated pie chart that provides you with a visual overview of how you are currently using your available storage. This chart displays used storage only, and will include up to three segments:
- Libraries
- Attachments
- Photos
If your system does not contain any of a given item (e.g. there are no photos in your Incident Logs), then the corresponding segment will be excluded from your chart.
The storage chart is automatically updated as applicable items are stored within your system, ensuring that your storage summary remains accurate over time. In addition, Activ provides you with the numerical data that is associated with each segment of your chart, enabling you to track changes from one month to the next. To view this information, simply hover over the appropriate segment of the chart. This will open a tooltip displaying:
- The type of storage associated with the segment.
- The number of GB that the storage type is currently using. Note that this is rounded to three decimal places, allowing storage to be displayed to the nearest MB (e.g. 0.624 GB is equivalent to 624 MB).
- The percentage of used storage that the storage type currently represents.