The Human Resources: Lateness area provides a set of graphs and reports that can be used to support company-level punctuality monitoring and analysis, allowing you to gain oversight of overall punctuality levels, identify company and team (if you have the Teams module) trends, and identify how much work time has been lost as a result of lateness.
One report is available:
In addition, two graphs are available:
To view your company’s graphs and reports open the Human Resources module and click on the Lateness tab, then select the appropriate button at the top of the screen. By default, each graph and report will display data from the past twelve months, but you can use the filters at the top of the screen to alter this date range if necessary. In addition, Activ also allows you to extract the graphs and their underlying raw data from your system using the two buttons at the bottom of each graph’s page:
- Save As Image, which generates a copy of the graph that can be saved to your computer.
- Export, which downloads a CSV file of the data to enable you to perform your own analysis.
*****
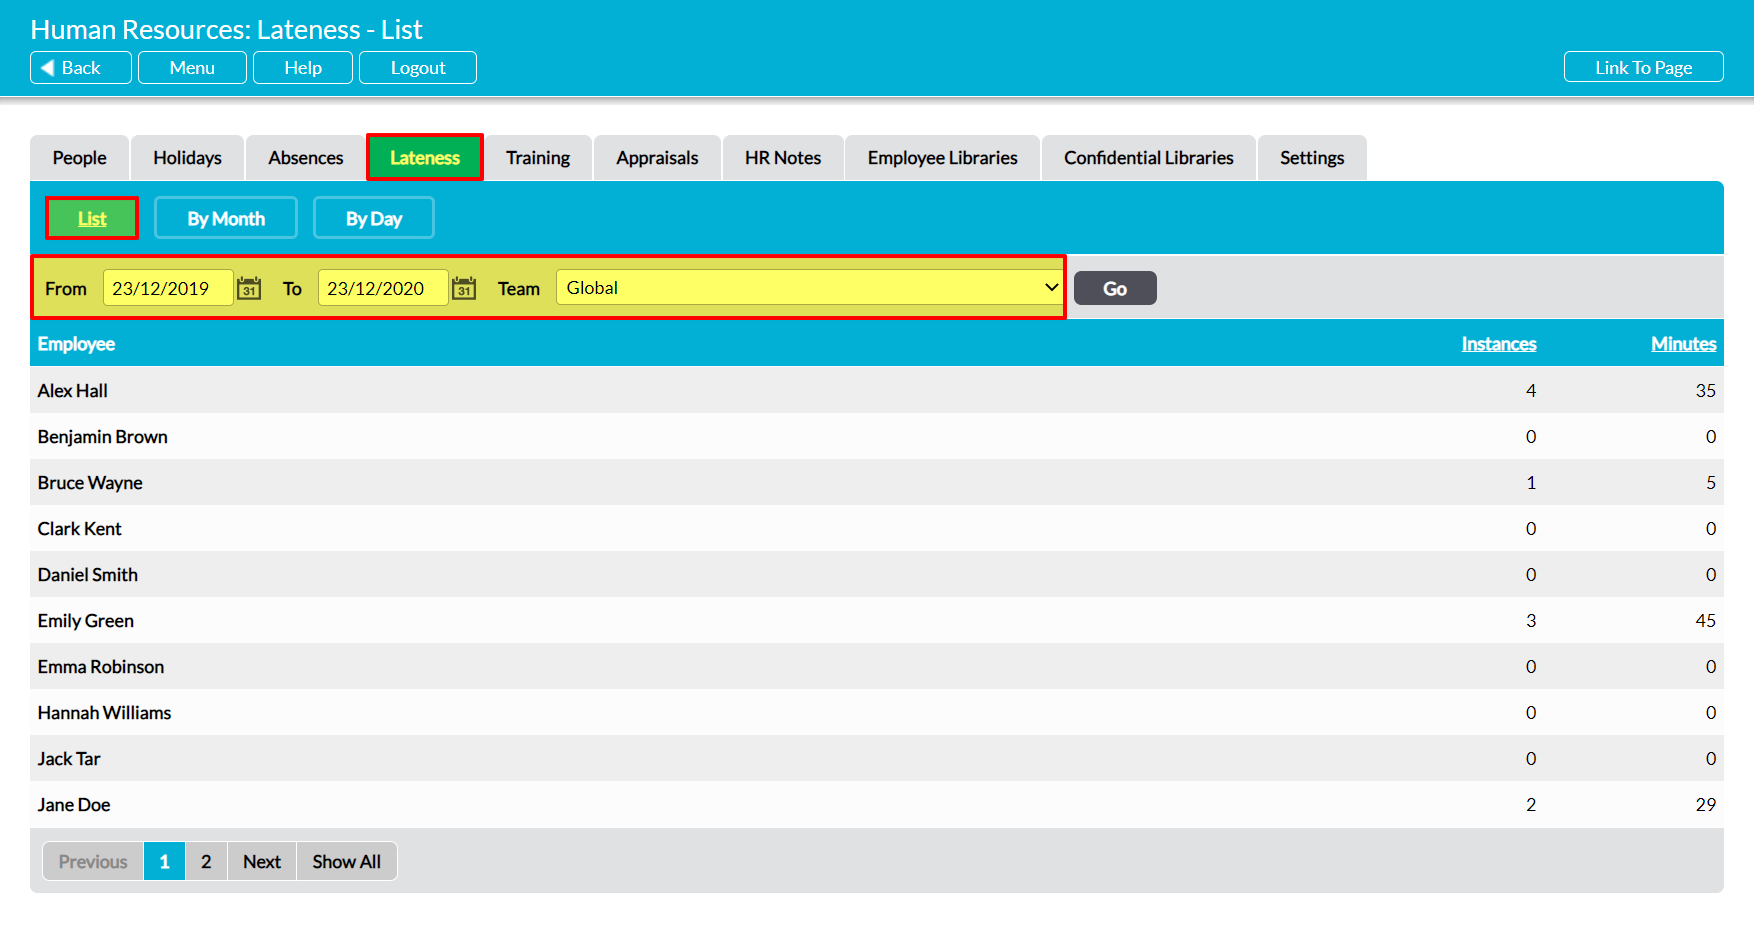
List Report
The Lateness tab will automatically open on the List section, which contains this report. The page will display a list of all employees that are recorded within your system, and provides a summary of individual and overall punctuality by number of instances and number of minutes late. By default it will include all employees within your company, but if your package includes the Teams module then you will also be able to analyse individual Team data using the filters at the top of the screen.
*****
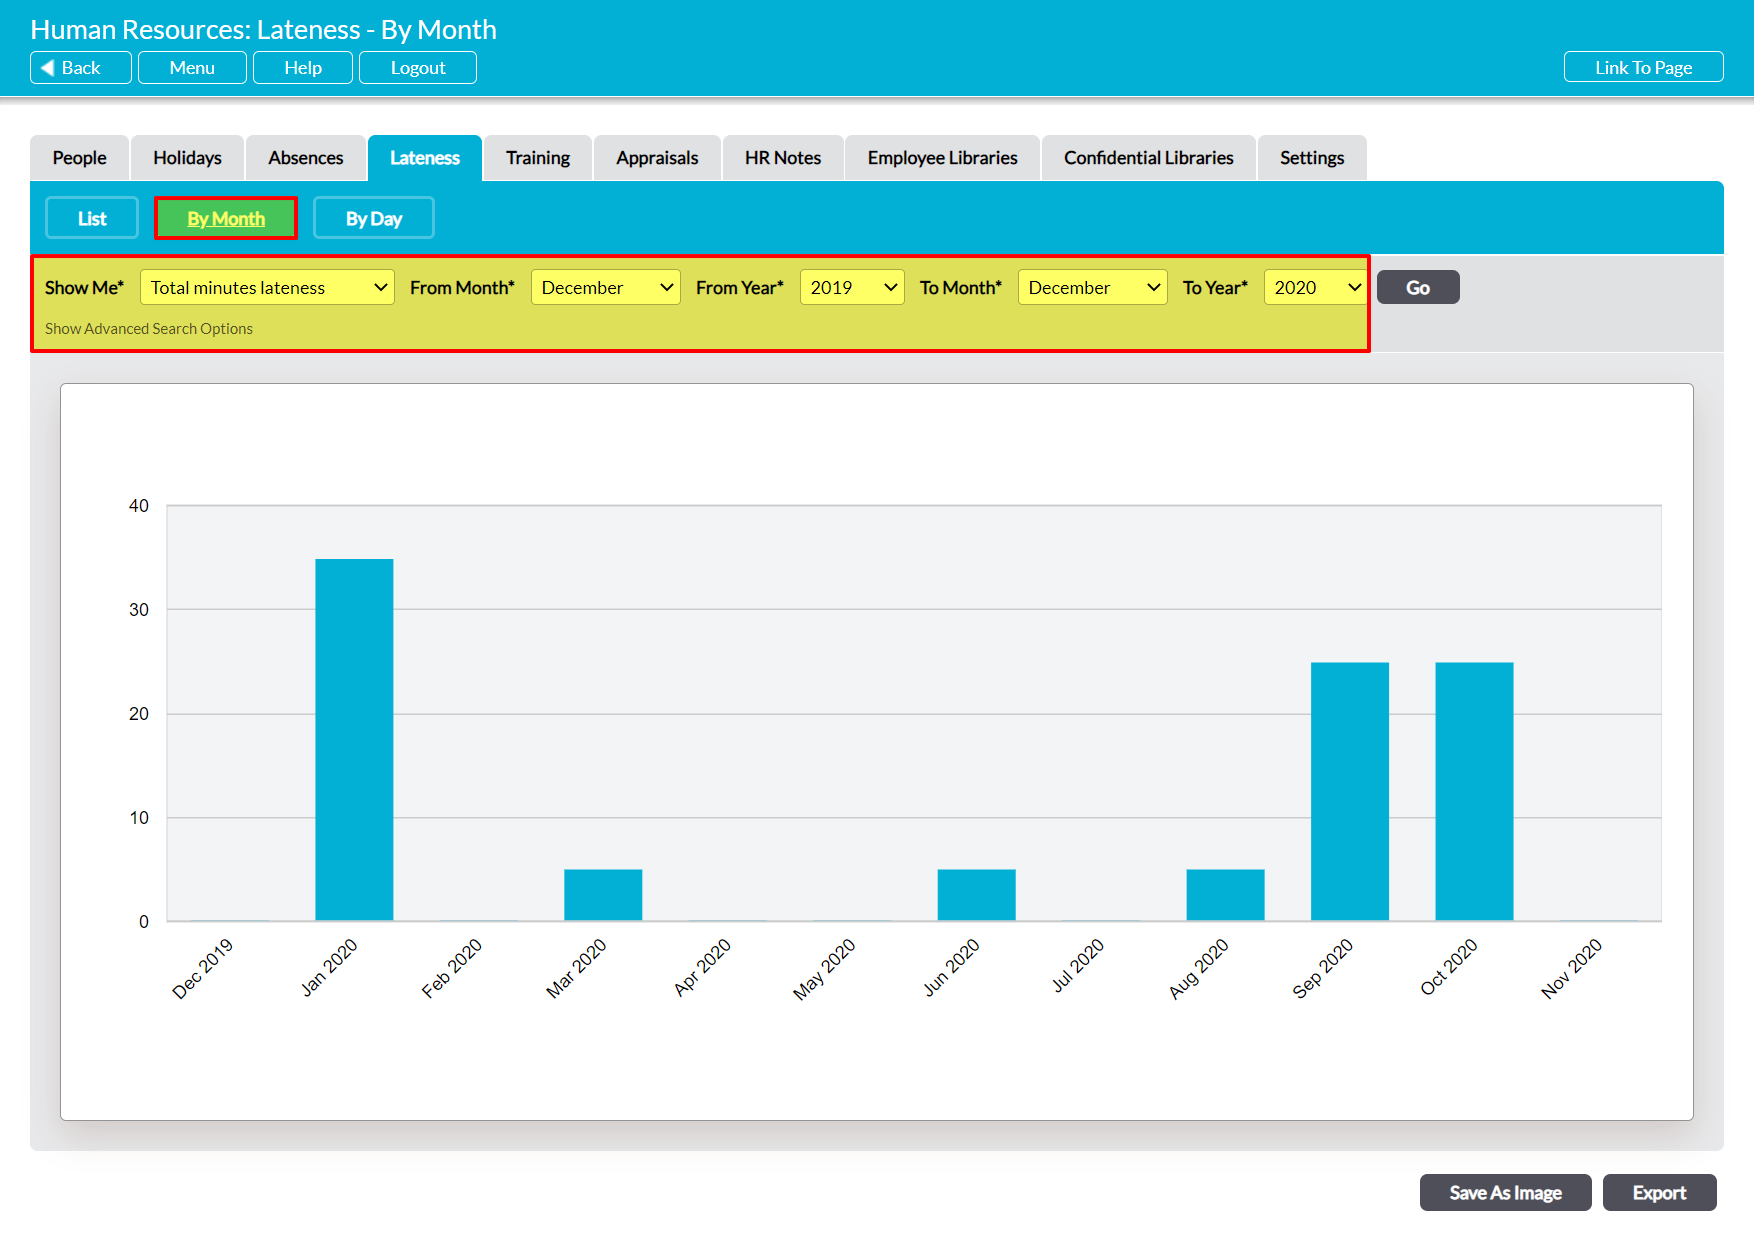
By Month Graph
To view this graph, open the Lateness tab and click on the By Month button at the top of the screen. Activ will provide you with a visual summary of the company’s punctuality data for each month within the selected date range.
If necessary, you can use the Show Me* filter at the top of the page to switch between:
- Total minutes lateness – the default option. This will display the total number of minutes employees have lost to lateness during the course of each month (e.g. if two employees were late in January and each instance was for five minutes, January will display a total of ‘10’).
- Number of instances – this will display the number of instances of lateness that were recorded against employees during the course of each month (e.g. if two employees were late twice during January, January will display a total of ‘4’).
*****
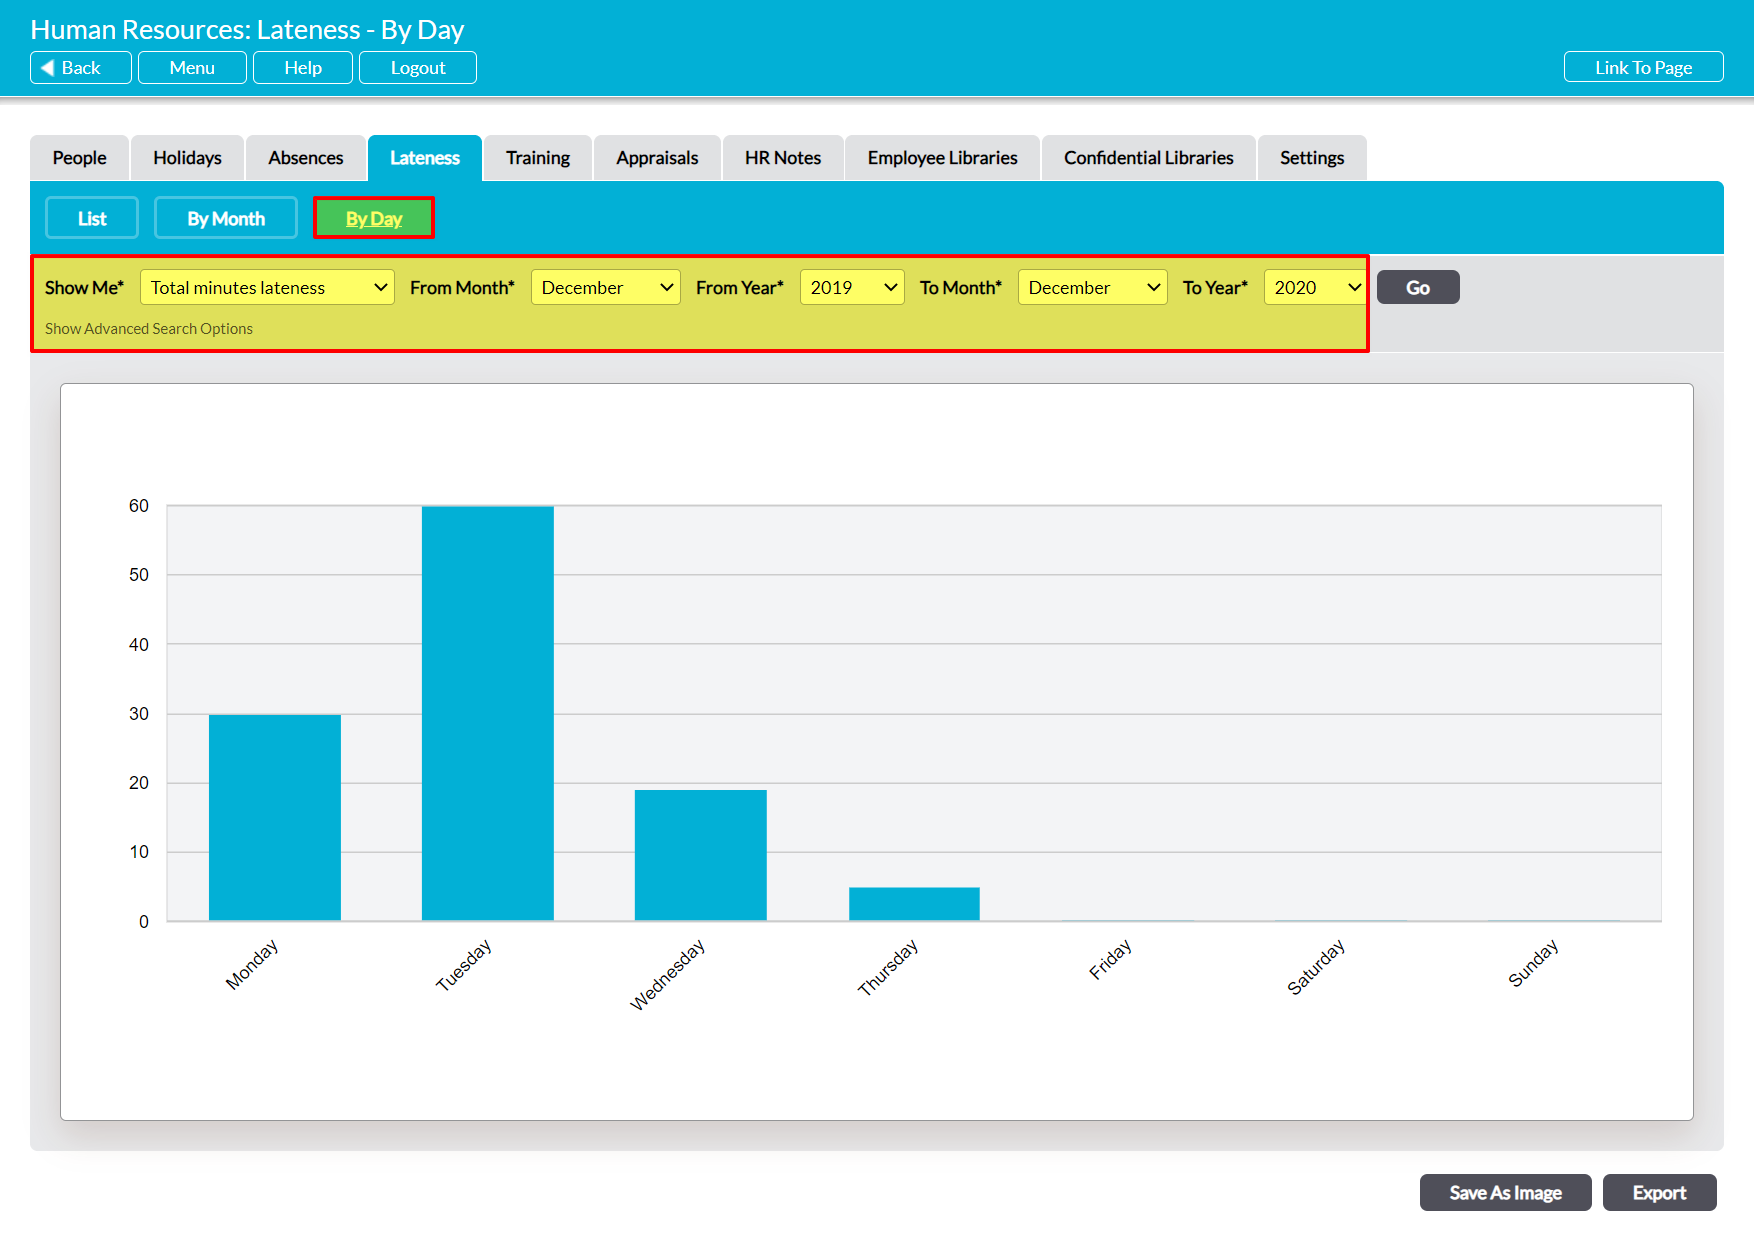
By Day Graph
To view this graph, open the Lateness tab and click on the By Day button at the top of the screen. Activ will provide you with a visual summary of the company’s punctuality data for each day of the week, allowing you to check whether employees are regularly late on specific days (e.g. on Mondays).
If necessary, you can use the Show Me* filter at the top of the page to switch between:
- Total minutes lateness – the default option. This will display the total number of minutes that employees have lost to lateness on each weekday (e.g. if two employees were late on Monday and each instance was for five minutes, Monday will display a total of ‘10’).
- Number of instances – this will display the number of instances of lateness that were recorded against employees on each day of the week (e.g. if two employees were late twice on a Monday, Monday will display a total of ‘4’).