You can analyse your database of risks/opportunities (Issues) in the Business Risk Manager module using the Reports and Graphs tabs.
The Reports tab allows you to generate a report in table form of the number of Issues per month matching your specified criteria. By default, the report shows all Issues in the system over the past six months. You can change the period to include in your report using the filters at the top of the tab:
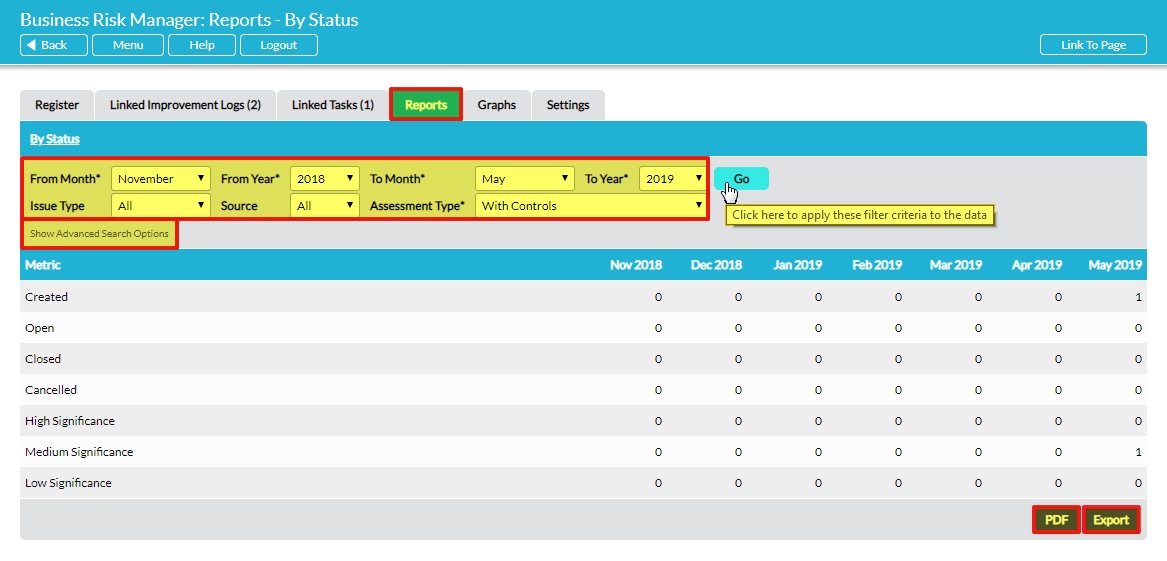
Click on Show Advanced Search Options to reveal further filters that you can use to specify the report you require. Available options are: Issue Type (risk or opportunity), Source (internal or external), Assessment Type (significance with or without controls), Category, Interested Party, and Site (if enabled – see Enable / Disable the ‘Sites’ Field in Forms).
When you have specified your reporting criteria, click on Go and your report will be generated, producing in table form the number of specified Issues in each month and the total.
If required, you can create a PDF of the report by clicking on the PDF button at the bottom right of the screen. You can also export the report data to a CSV file by clicking on the Export button at the bottom right of the screen.
*****
The Graphs tab’s functionality is identical to the Reports tab but produces a graph of the number of Issues per month matching your specified criteria (instead of a table). You can export the graph data to a CSV file by clicking on the Export button at the bottom left of the screen.
