The Frequency Rates feature of Activ allows you to generate a line graph plotting the frequency rates of Reportable Accidents or Recorded Injuries. The graph plots the Frequency Rate statistic for each of 12 months for the period specified by you.
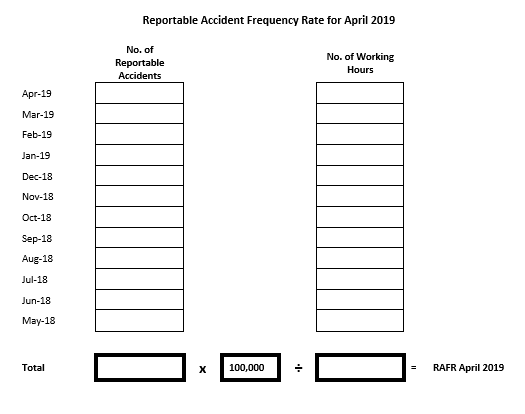
The Reportable Accident Frequency Rate (RAFR) is defined in Activ as the number of reportable accidents occurring in a 12-month period per 100,000 hours worked.
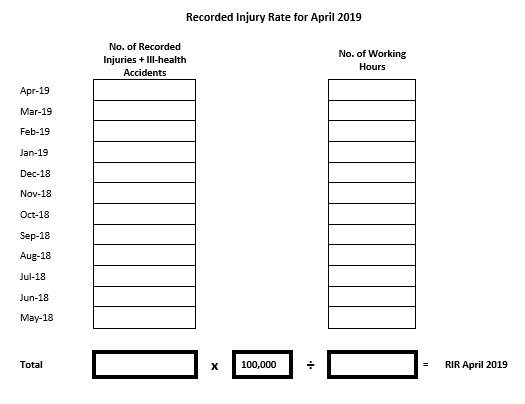
The Recorded Injury Rate (RIR) is defined in Activ as the number of recorded accidents relating to an injury or instance of ill health occurring in a 12-month period per 100,000 hours worked.
It is worth clarifying exactly how the statistic is calculated for each month. The following tables set out how the Reportable Accident Frequency Rate (RAFR) and the Recorded Injury Rate (RIR) would be calculated for April 2019:
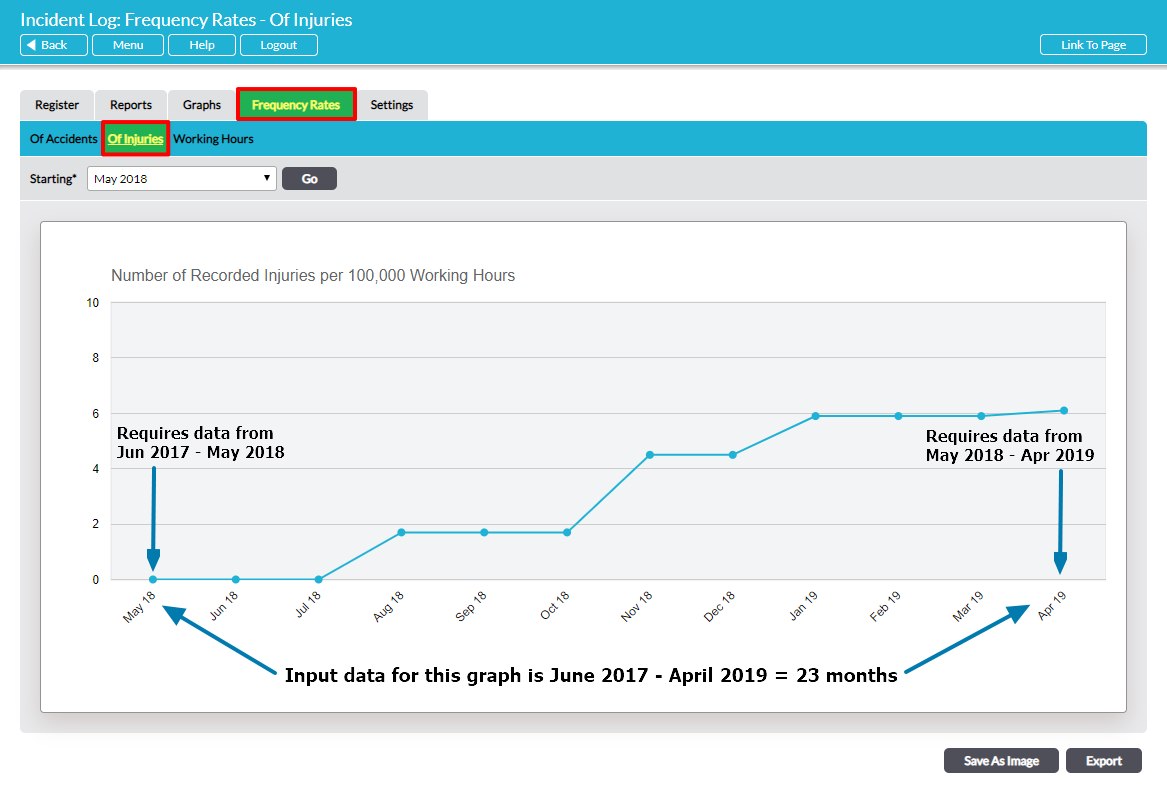
Note that the RAFR or RIR statistic for any month requires data from that month and the 11 preceding months. As the Frequency Rates graph shows the RAFR or RIR for 12 consecutive months, in order for the graph produced in Activ to be meaningful, you must have at least 23 months’ data on incidents and Working Hours recorded in Activ. The graph below illustrates:
The data on accidents and injuries is taken automatically from your Incident Logs within Activ. The only additional data that is required to generate the Frequency Rates graph is the total number of working hours per month, which you must enter manually on the Frequency Rates tab.
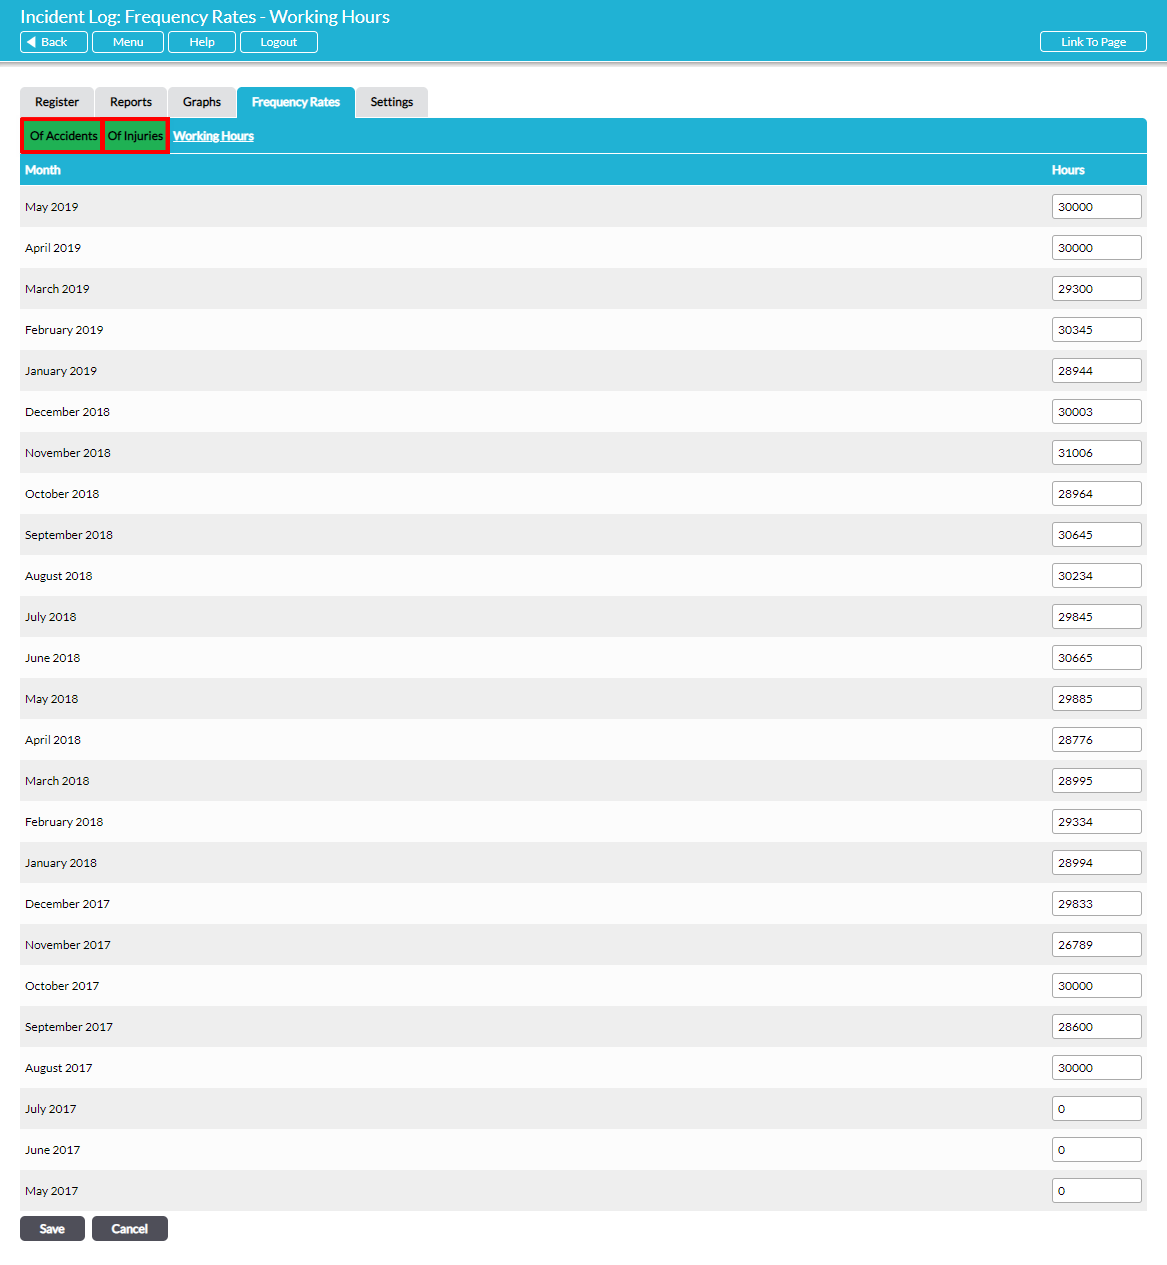
Open the Incident Log module and select the Frequency Rates tab. Select the Working Hours sub-page. To enter/edit the total hours worked for any month, click the Edit button at the bottom of the page:
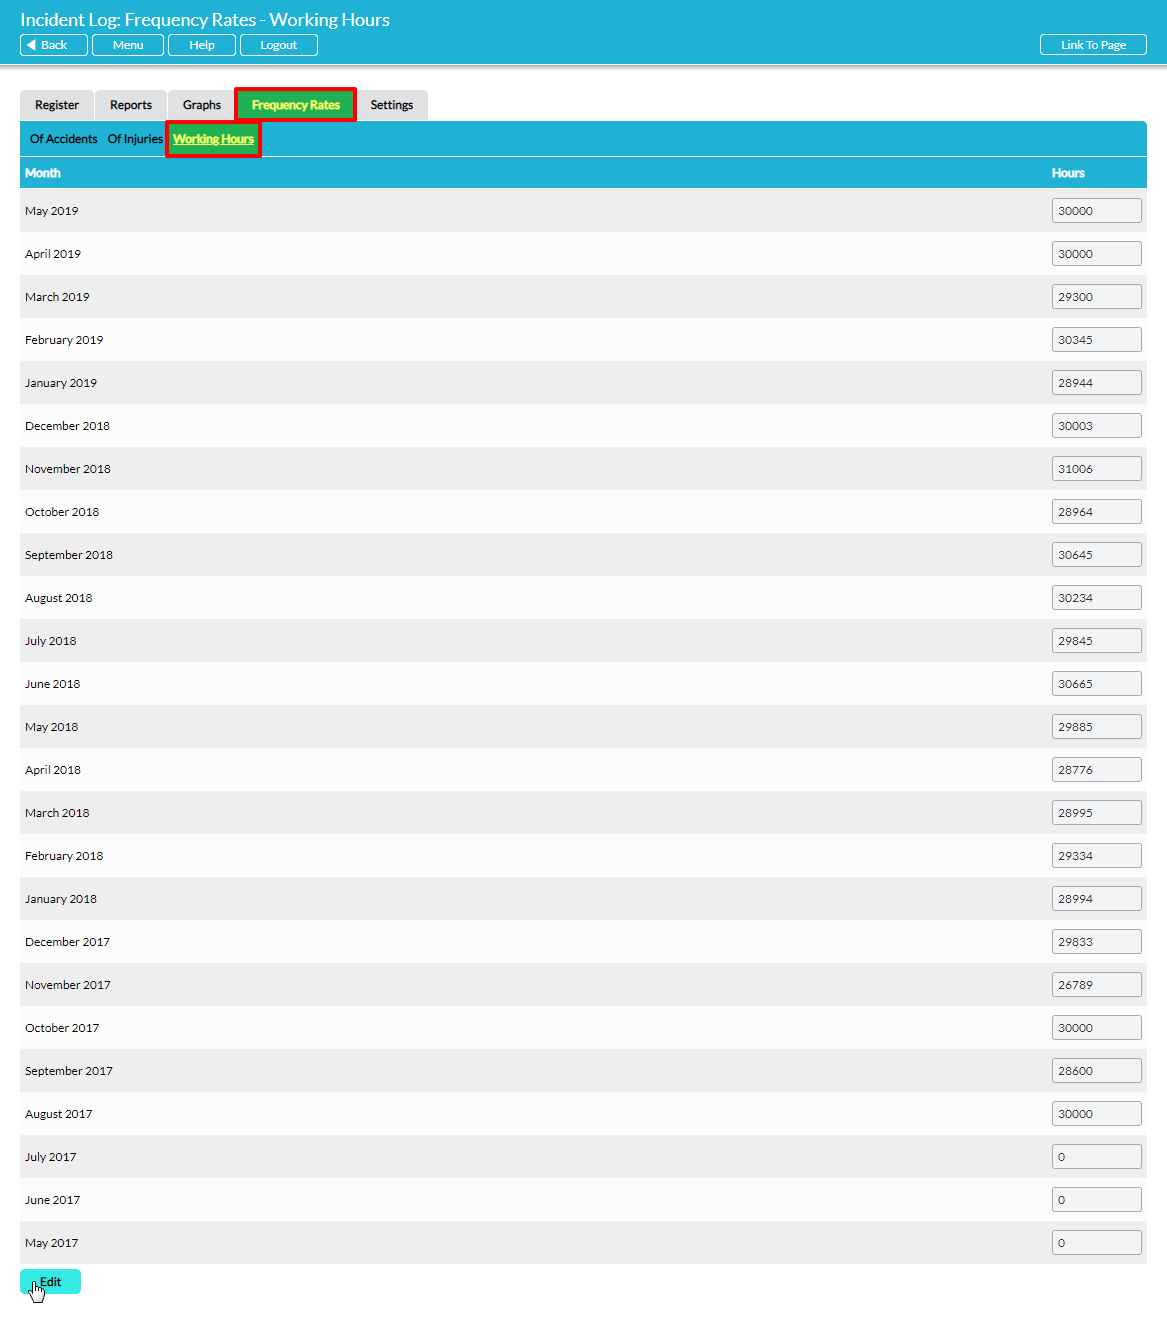
Enter/edit the total man-hours worked for each month as required. Activ will store the hours you enter for future use, so you will only need to enter the number of hours for any month once. Click on Save to complete the process.
Now, you can view the Reportable Accident Frequency Rates graph or Recorded Injury Frequency Rates graph by clicking on Of Accidents or Of Injuries at the top of the page:
You can specify the 12-month period you wish to be plotted by selecting the starting month from the drop-down menu in the Starting* field and clicking on Go:
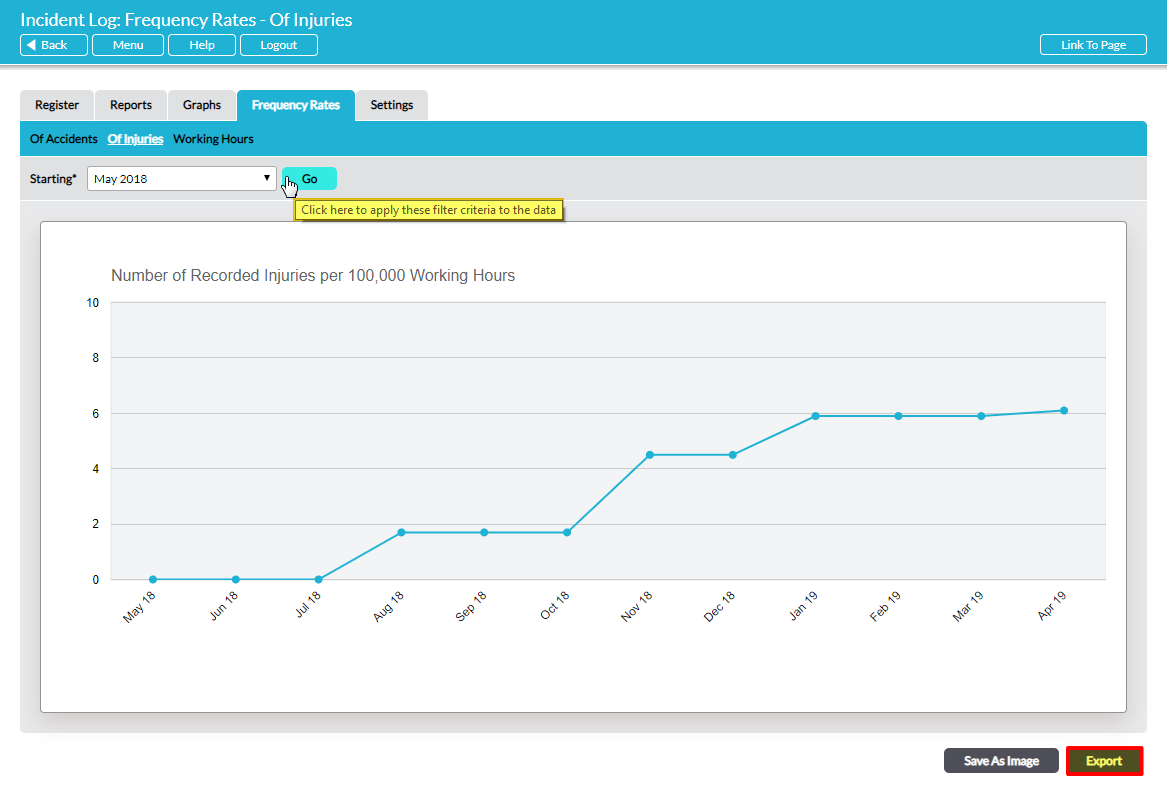
If required, the graph data can be exported to a CSV file by clicking on the Export button.
