The Asset Manager module includes a set of reports that can be used to help you analyse the key statistics relating to your organisation’s Stock management, allowing you to gain oversight of how your Stock usage and value changes over time.
To view your company’s reports, open the Asset Manager module and click on the Reports tab, then select the appropriate button at the top of the screen. By default, most of these reports will display data from the past six months, but you can use the filters at the top of the screen to alter this date range if necessary. In addition, Activ also allows you to extract the raw data for each report from your system so that you can perform your own analysis if necessary. To do so, click on the Export button at the bottom of the appropriate report.
The Asset Manager includes two reports that are relevant to Stock Control. These are:
In addition to these, seven further reports are available. These are:
- Jobs Completed
- Overview by Month
- Overview by Site
- By Engineer
- By Category
- By Site
- By Asset
See Reports: Analysing Job Management for more information about these additional reports.
*****
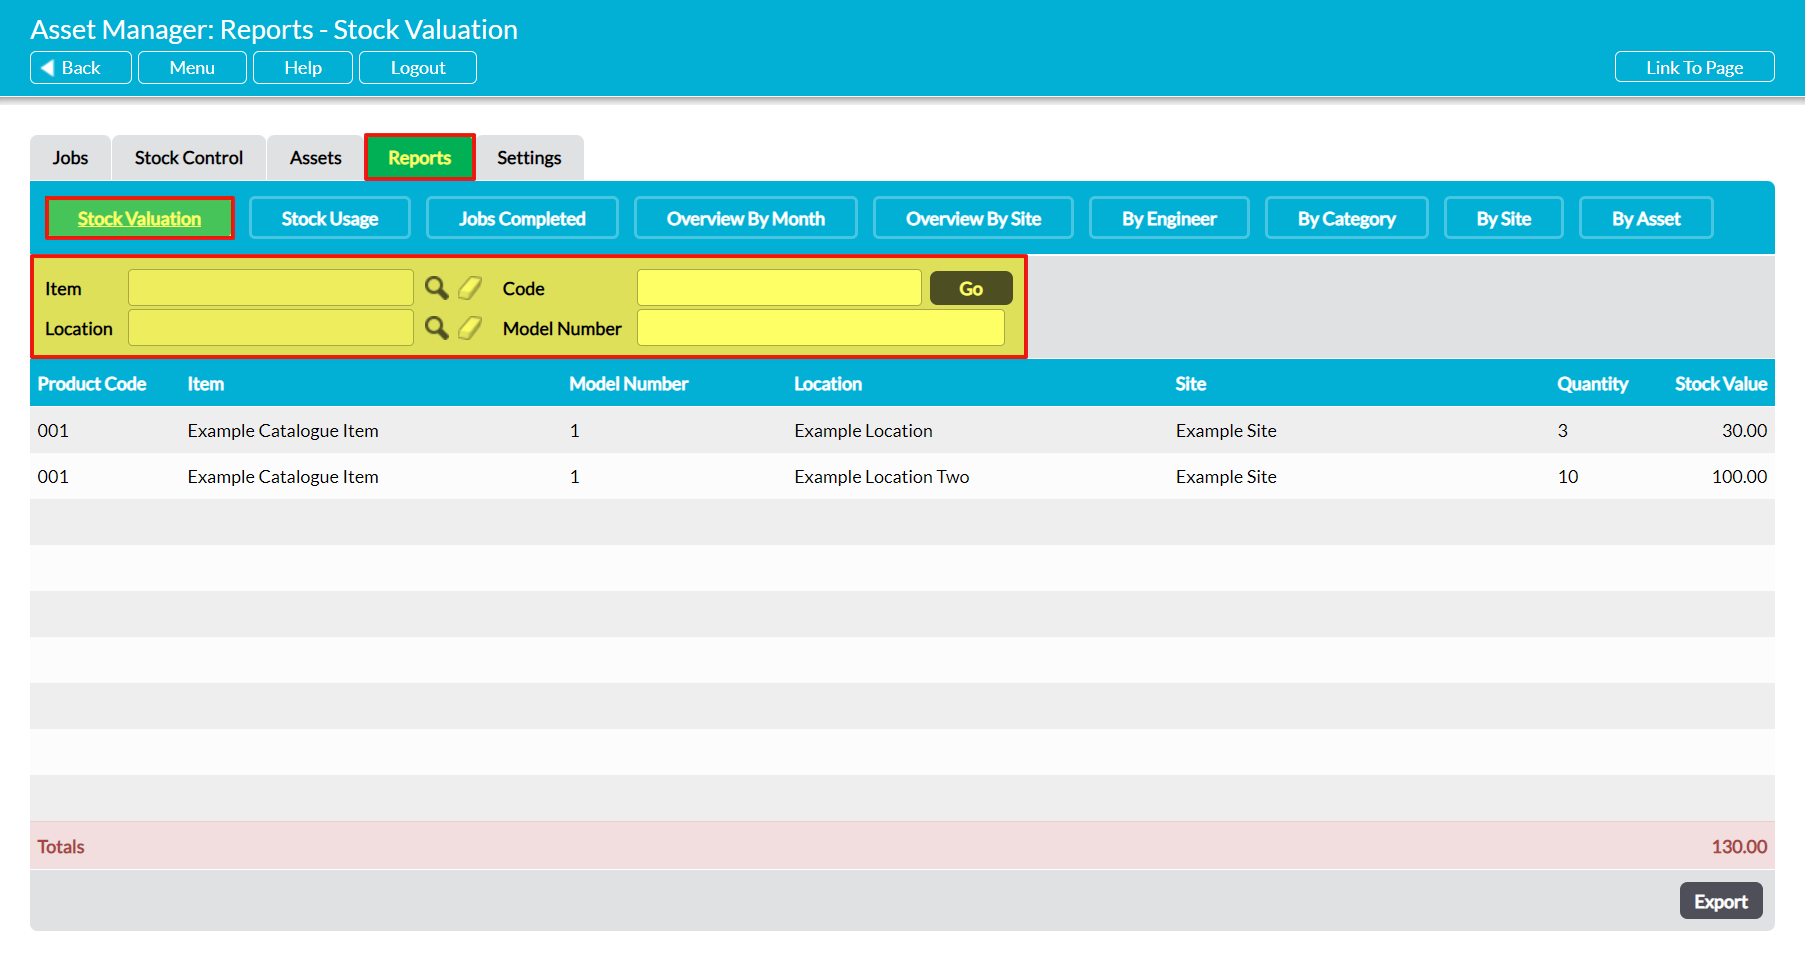
Stock Valuation Report
To view this report, open the Reports tab and click on the Stock Valuation button at the top of the page. Activ will provide a list of all of the Stock Listings that are recorded within your system, and display the total quantity and value of the Stock that is currently associated with each Listing. In addition, Activ will provide you with an overall Stock value (i.e. the total value of all Stock in your system) and display this figure in the Totals row at the bottom of the screen.
Note that this report will only display the value of your current unused Stock. It does not include historic data, and will not allow you to view Stock values from previous months. However, Activ does provide the option for you to filter the report by Item, Location, Code, or Model Number, enabling you to view the values of different groups of Stock. Use the options at the top of the screen to enable these filters.
*****
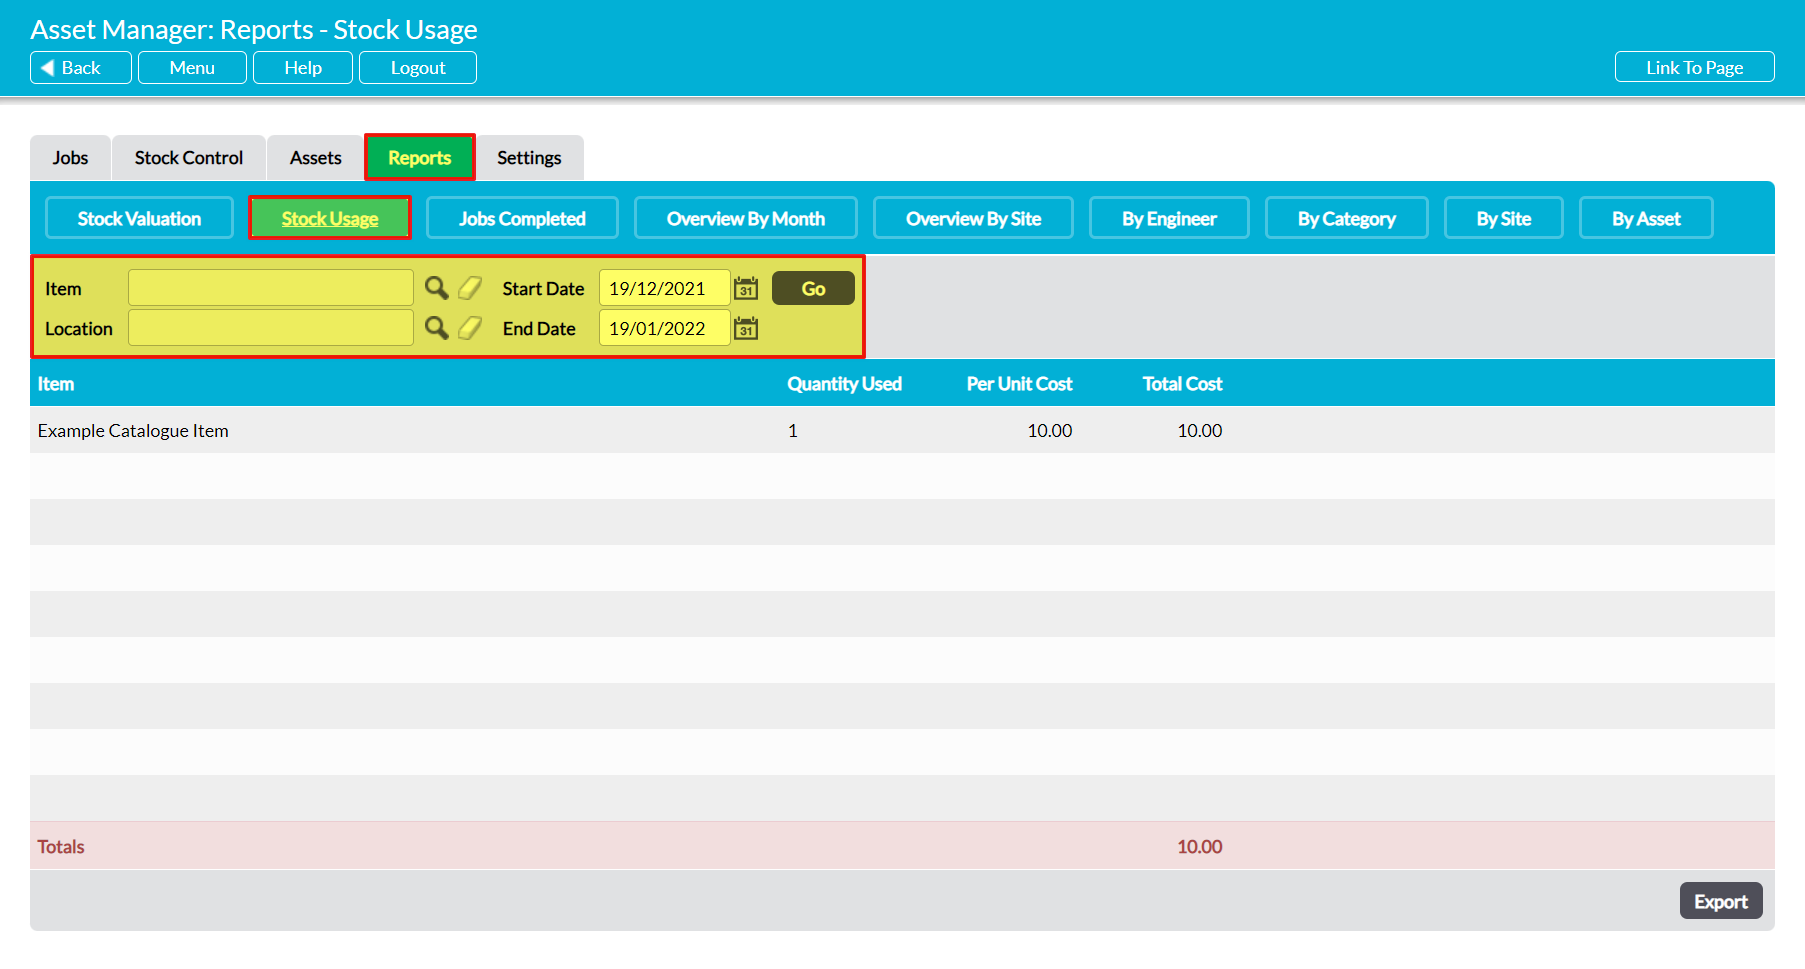
Stock Usage Report
To view this report, open the Reports tab and click on the Stock Usage button at the top of the page. Activ will provide a list of all Stock Items that have been used within maintenance Jobs during the selected period, and display the total quantity and value (Per Unit Cost / Total Cost columns) of the Items used. In addition, Activ will provide you with an overall cost value (i.e. the total value of all Stock that has been used during the selected period) and display this figure in the Totals row at the bottom of the screen.
By default, this report will include data from the past 30 days, and will display all Stock Items that have been used during that time. However, Activ also provides you with the option to extend or change this date range, and to filter the report by Item or Location. Use the options at the top of the screen to enable these filters.