The Customers & Suppliers: Feedback area provides a selection of pre-made graphs that can be used to help analyse the Feedback that you receive from your Feedback Surveys. However, it is important to note that Activ cannot analyse data from questions that are not ratings-based, as these lack underlying scores for your system to compare.
Activ’s graphs provide a visual representation of the numerical scores that lie behind each rating-based answer that has been included within your Feedback Surveys. For example, a Feedback Survey that has two rating questions based on a rating system with the scores 1-5 can score between 2 and 10 points if all questions within the Survey are answered. This will be represented as appropriate within each graph.
Three graphs are available:
To view your system’s graphs, open the Customers & Suppliers: Feedback area and click on the Graphs tab, then select the appropriate button. All graph sections are paired to their own set of filters, which can be used to customise the information that is summarised and the date range to be drawn from. In addition, graphs are generated on a by-template basis, meaning that data is only compared for those Feedback Surveys that are based on the same template. Use the Survey Template* filter in each section to select which set of Feedback Surveys should be analysed.
Activ also allows you to extract the graphs and their figures from your system using the two buttons at the bottom of each section:
- Save As Image, which generates a copy of the graph that can be saved to your computer
- Export, which downloads a CSV file of the data to enable you to perform your own analysis
*****
By Owner
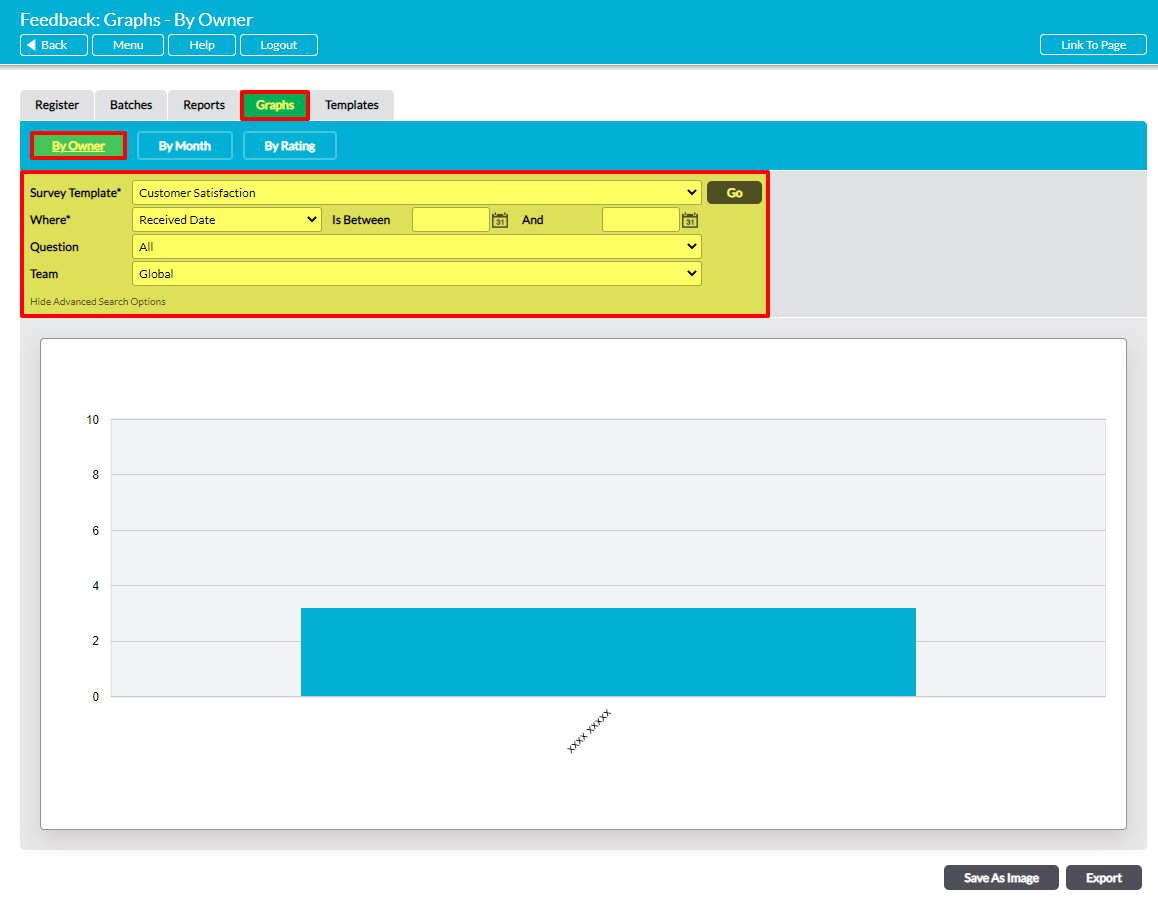
The Graphs tab will automatically open on the By Owner section. This graph analyses the data by Feedback Survey owner, and provides a visual representation of the average Feedback score recorded across all Feedback Surveys that each individual is responsible for.
By default, this graph includes all users who currently own a Feedback Survey. However, the following options are available to enable you to customise the result of this analysis:
- Where*, which allows you to specify whether to filter by received date or created date.
- Is Between/And, which allows you to specify a date range for the analysis.
- Question, an advanced search option which allows you to filter the data by a specific question within the selected template.
- Team, an advanced search option that is available if you have the Teams module, and that allows you to analyse Feedback Responses by Team.
*****
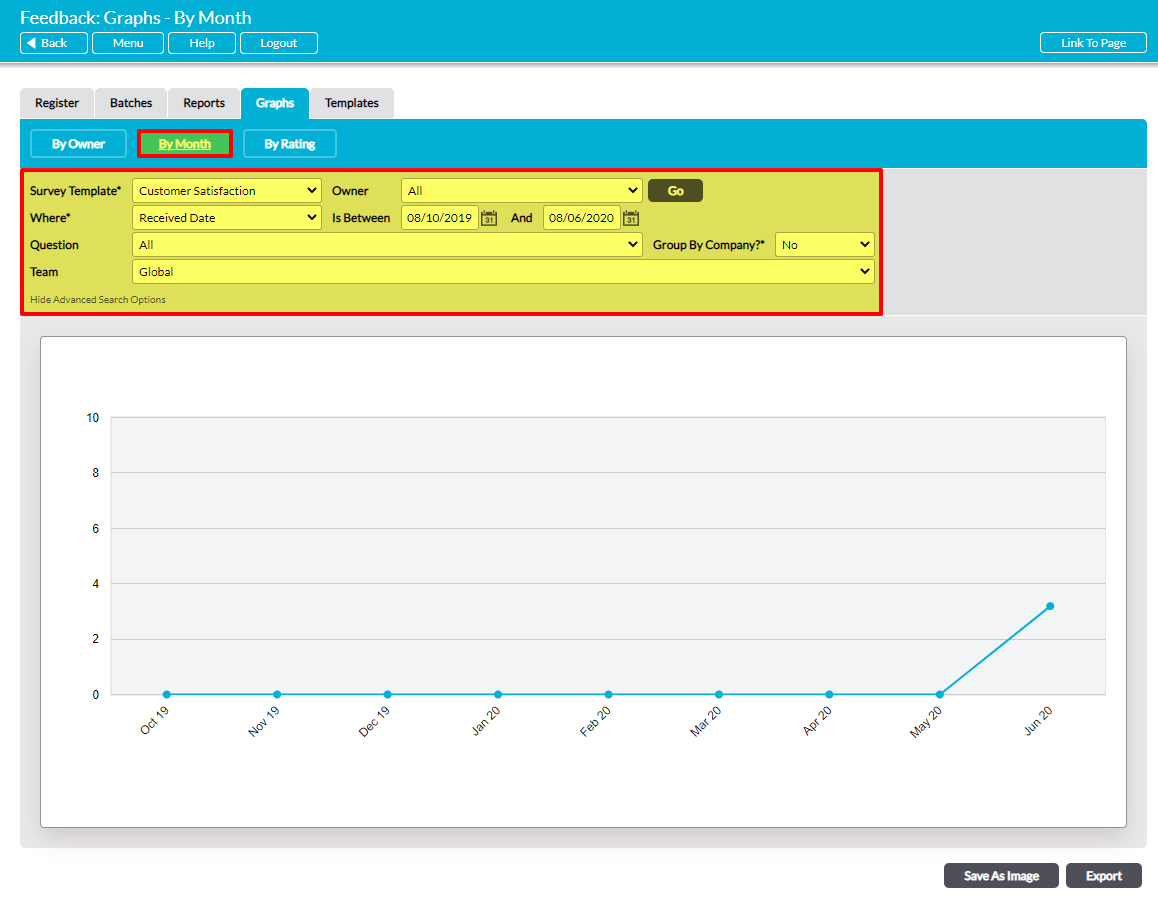
By Month
The By Month section analyses the data by the month on which Feedback Survey responses were received. It provides a visual representation of the average Feedback score recorded across all Feedback that was submitted each month.
By default, this graph includes all rating-based data that has been submitted to Feedback Surveys of the selected type. However, the following options are available to enable you to customise the results of this analysis:
- Owner, which allows you to filter by Feedback Survey owner.
- Where*, an advanced search option which allows you to specify whether to filter by received date or created date.
- Is Between/And, an advanced search option which allows you to specify a date range for the analysis.
- Question, an advanced search option which allows you to filter the data by a specific question within the selected template.
- Group By Company?*, an advanced search option that allows you to group scores by company, allowing you to easily compare all scores each company has given the selected Feedback Survey over time. By default this is set to ‘No’.
- Team, an advanced search option that is available if you have the Teams module, and that allows you to analyse Feedback Responses by Team.
*****
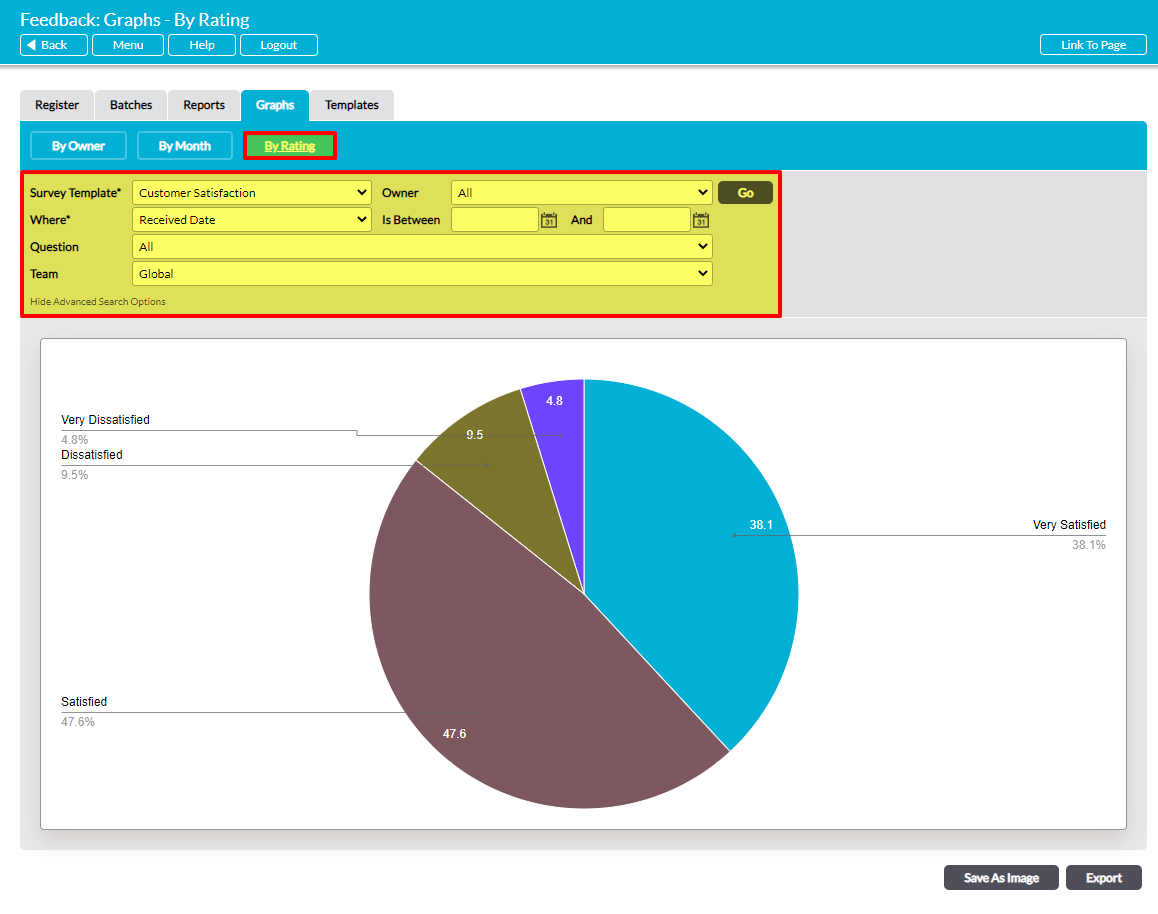
By Rating
The By Rating section analyses the data by the individual ratings that are included in the selected Feedback Survey. It provides a visual representation of the percentage split of ratings that have been recorded against your Feedback Surveys, and may be particularly useful where you need to gain an understanding of your contacts’ overall perception of your company.
By default, this graph includes all rating-based data that has been submitted to Feedback Surveys of the selected type. However, the following options are available to enable you to customise the results of this analysis:
- Owner, which allows you to filter by Feedback Survey owner.
- Where*, an advanced search option which allows you to specify whether to filter by received date or created date.
- Is Between/And, an advanced search option which allows you to specify a date range for the analysis.
- Question, an advanced search option which allows you to filter the data by a specific question within the selected template.
- Team, an advanced search option that is available if you have the Teams module, and that allows you to analyse Feedback Responses by Team.