As standard, the Customers & Suppliers: Companies area provides graphs and figures that can be used to help you analyse your third-party Company’s responses to Feedback Surveys. In addition, if your package includes the Improvement Logs module then this functionality will be expanded to include analysis of third-party Improvement Log status. In both instances, this analysis is provided on an individual Company basis, allowing you to easily review a summary of each Company’s Feedback responses and Improvement Log statuses. This can be particularly useful when analysing a Company’s responses to longer Feedback Surveys, when monitoring a Company’s Feedback over time, or where a Company is associated with multiple Improvement Logs.
*****
To view an individual Company’s graphs and figures, open the Company’s record within the Customers & Suppliers: Companies area and click on the Graphs tab. This will open a page that houses up to three graph sections:
- Feedback by Month
- Feedback Breakdown
- Improvement Status, if your package includes Improvement Logs.
All graphs are paired to their own sets of filters, which can be used to customise the information that is summarised and the date range to be drawn from. In addition, Activ allows you to extract the graphs and their figures from your system using the two buttons at the bottom of each section:
- Save As Image, which generates a copy of the graph that can be saved to your computer
- Export, which downloads a CSV file of the data to enable you to perform your own analysis
*****
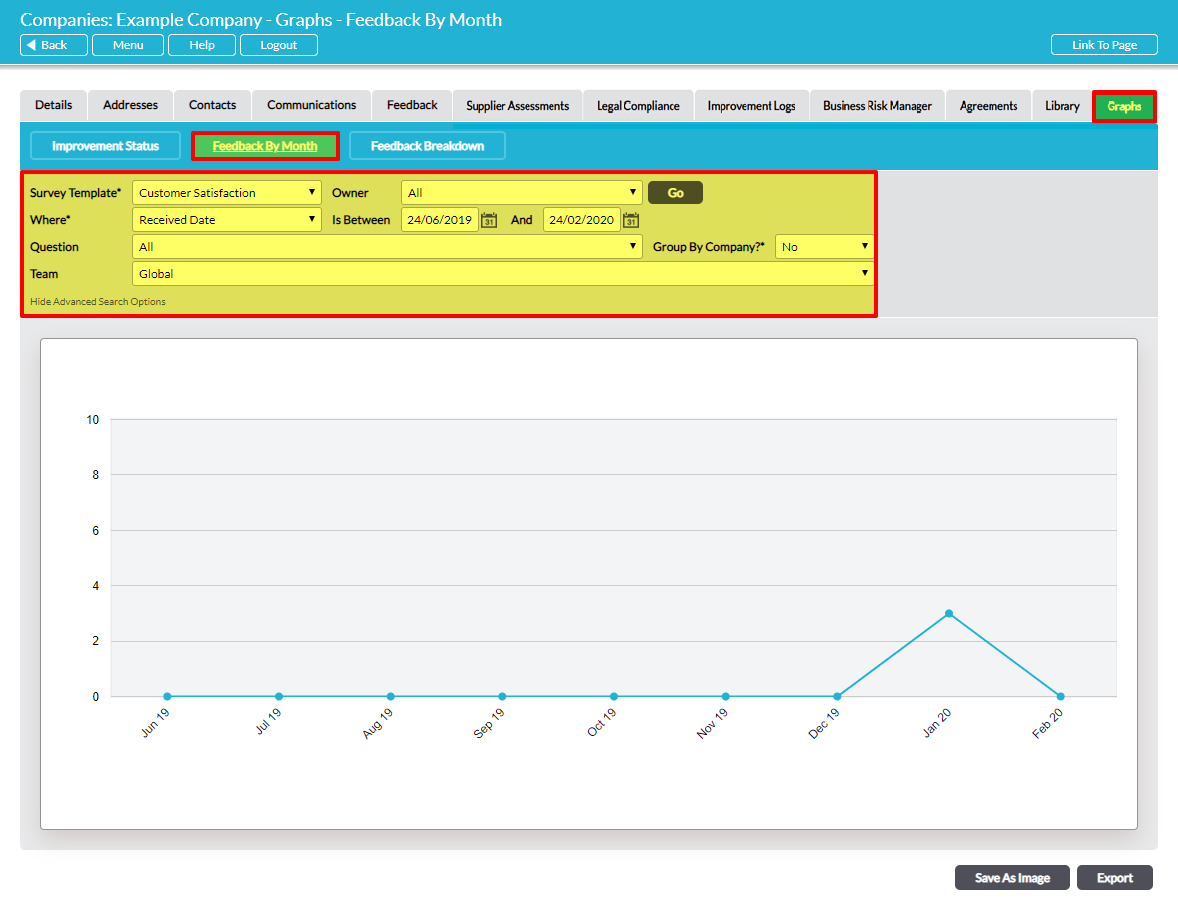
Feedback by Month
For most systems, the Graphs tab will automatically open on the Feedback By Month section. This graph summarises the average scores of all Feedback Surveys that have been answered by the Company during the selected period.
By default, the section’s graph shows data from the last six months and provides the average overall scores for completed Feedback Surveys. However, the following options are available to enable you to customise the result of this analysis:
- Survey Template, which allows you to define which Feedback Surveys should be analysed.
- Owner, which allows you to narrow the results by the user who owns the Survey.
- Where*, which allows you to define whether to filter by the date that the Survey was filled out, or the date that it was created.
- Is Between / And, which allows you to specify the date range for the analysis.
- Question, an advanced search option that allows you to narrow the analysis to specific questions within your Feedback Survey.
- Group By Company?*, an advanced search option that allows you to define whether to group results by Company.
- Team, an advanced search option that is available if you have the Teams module, and that allows you to filter the data by Team.
*****
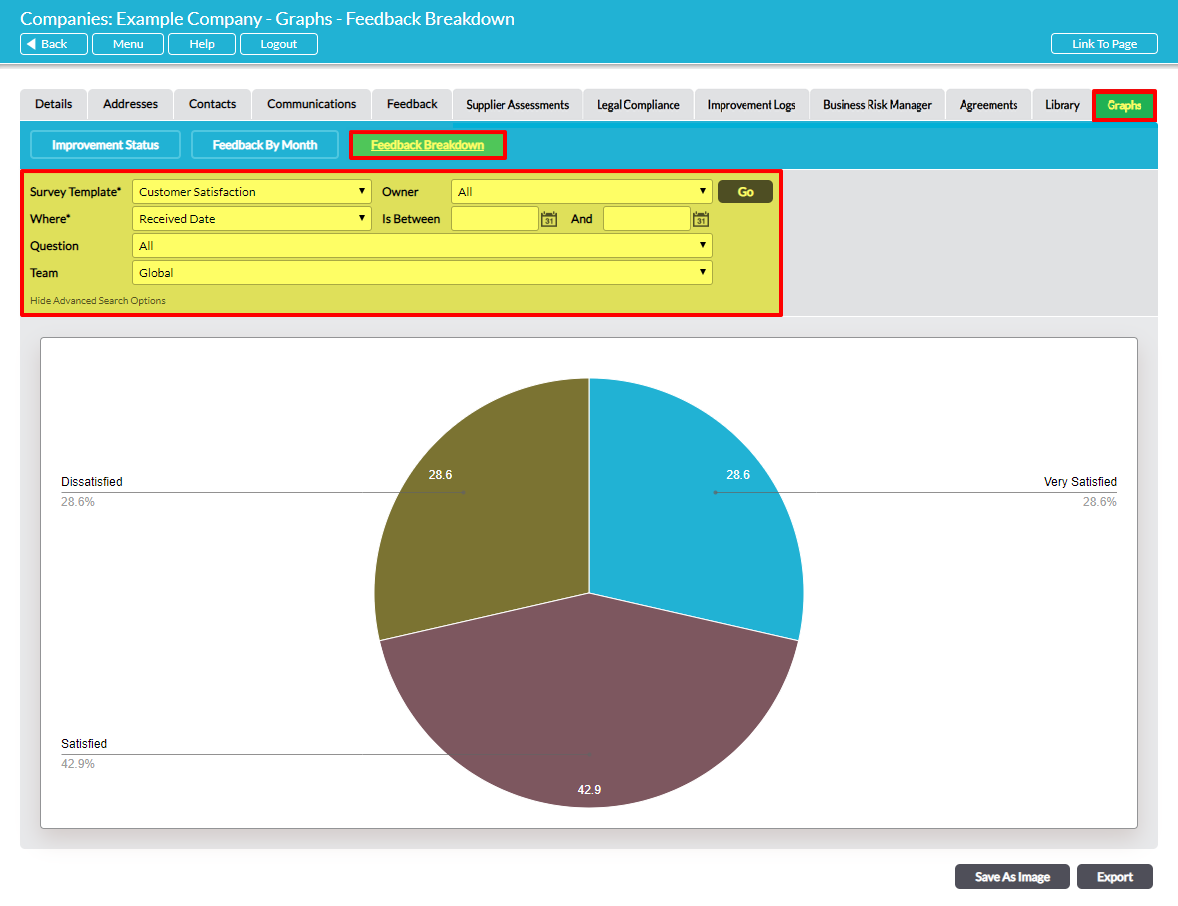
Feedback Breakdown
The Feedback Breakdown section provides a percentage-based overview of a Company’s responses to Feedback Surveys, enabling you to identify what proportion of questions was given each available answer. It offers a closer view of responses than does Feedback By Month, enabling you to more readily identify a third party’s degree of satisfaction with your product/service, highlight the use of any responses that might not be apparent from the Feedback By Month graph, and easily track changes in response over time.
By default, the section’s graph shows data from all questions that are associated with the selected template, but the following options are available to enable you to customise your results:
- Survey Template*, which allows you to define which Feedback Survey should be analysed.
- Owner, which allows you to narrow the results by the user who owns the Survey.
- Where*, which allows you to define whether to filter by the date that the Survey was filled out, or the date that it was created.
- Is Between / And, which allows you to specify a date range for the analysis.
- Question, an advanced search option that allows you to narrow the analysis to specific questions within your Feedback Survey.
- Team, an advanced search option that is available if you have the Teams module, and that allows you to filter the data by Team.
*****
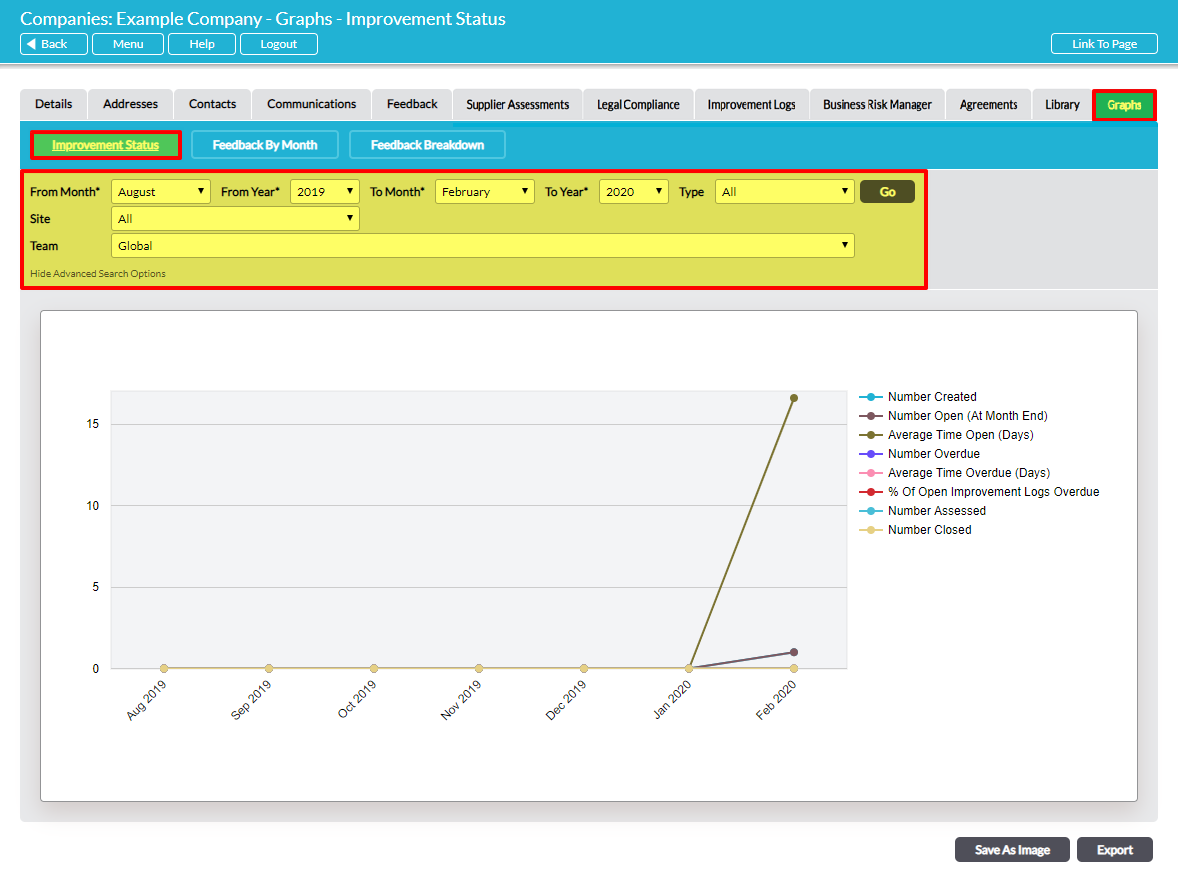
Improvement Status
If your package includes the Improvement Logs module, the Graphs tab will automatically open on the Improvement Status section. This graph summarises the number and status of Improvement Logs that have been raised against the Company, enabling you to obtain an overview of how frequently Improvement Logs are raised against each Company, and how quickly they are resolved.
By default, the section’s graph shows data from the last six months and includes all of the Improvement Log Types that exist within your system. However, the following options are available to enable you to customise the result of this analysis:
- From Month* / To Month*, which allows you to specify the month range for the analysis.
- From Year / To Year*, which allows you to specify the year range for the analysis.
- Type, which allows you to specify which types of Improvement Logs should be analysed.
- Site, an advanced search option that is available if you have enabled Sites, and that allows you to filter the data by Site.
- Team, an advanced search option that is available if you have the Teams module, and that allows you to filter the data by Team.