If you wish to perform your own analysis of your Improvement Log database, you can export all the raw data to a .csv file. See Export Improvement Log Records – PDF and .csv for guidance. The Reports and Graphs tabs automate this analysis for you, producing a number of ready-made and configurable reports and graphs at the click of a button.
*****
Reports
The Reports tab generates statistical reports from your Improvement Log database in table form.
There are eight ready-made reports: By Type, By Area, By Area & Type, By Person, By Priority, By Company (only present if you have Activ’s Customers & Suppliers module), By Status and By Site & Status.
By default, all reports show data covering the most recent six months. Each report has several filters that allow you to select the date range and to narrow the report by other criteria, to produce custom reports.
You can produce a PDF of your report and/or export the raw data of your report to a .csv file.
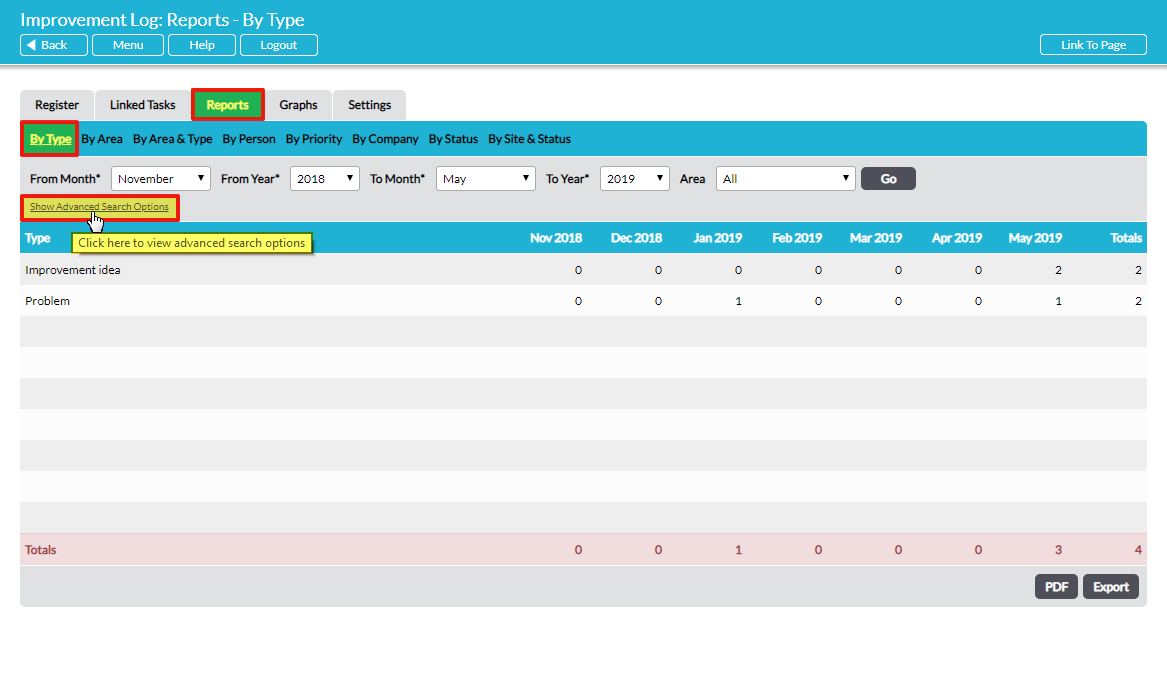
The By Type report is used to illustrate, but the principles are the same for all the reports. The default report shows data for the most recent six months (including the current one) and includes all Improvement Log Areas. Click on Show Advanced Search Options to reveal further filters:
To customise the report, make the relevant selections in the filters and click on Go:
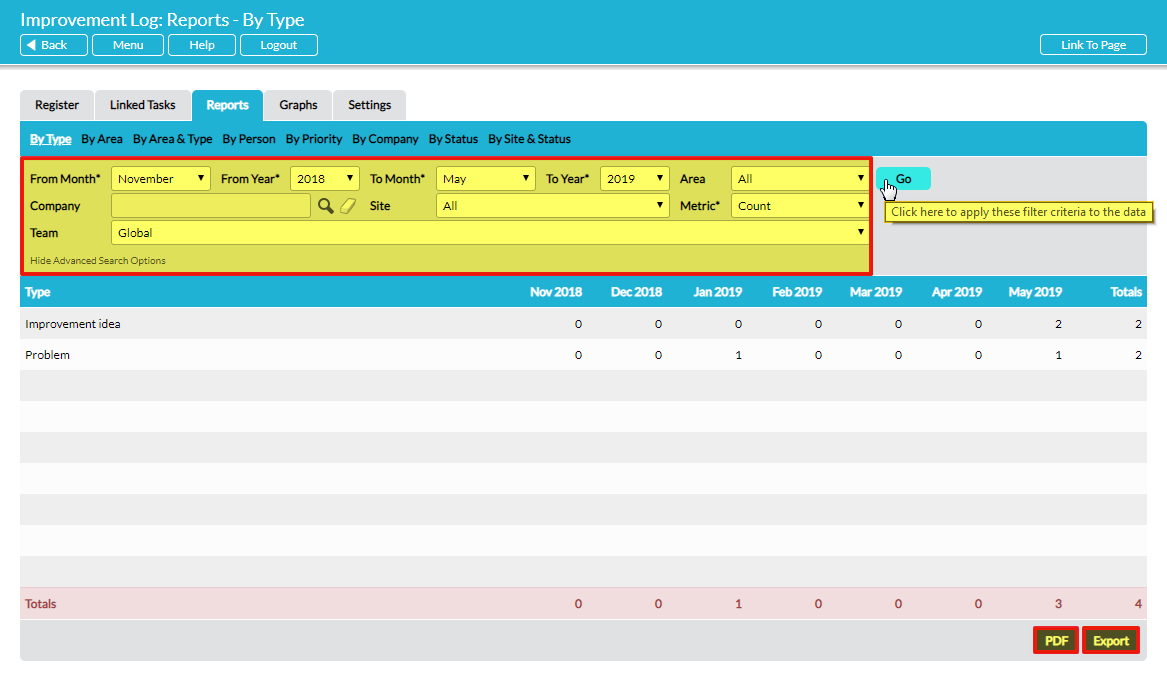
Click on PDF to generate a PDF file of your report, or on Export to generate a .csv file containing the raw data for further manipulation.
Graphs
The Graphs tab’s functionality is similar to the Reports tab but presents the results in graph format instead of table format.
There are five ready-made reports: By Type, By Area, By Person, By Priority and By Status.
To customise any graph, make the relevant selections in the filters and click on Go.
Click on Save As Image to create an image file of your graph, or on Export to generate a .csv file containing the raw data for further manipulation.
