Audit Manager produces a comprehensive suite of automatic reports to allow you analyse and report on your audit activity and performance. In Audit Manager, select the Analysis Reports tab. There are 6 sub-pages, each housing a different report type:
The filters at the top of each sub-page allow you to tailor the report to cover your required time period and to filter according to specific criteria.
Each report type can be reproduced in PDF format by clicking on the PDF button at the bottom right of the screen.
Alternatively, the Export button generates a csv file containing the raw data of the displayed report, which can be manipulated for further analysis outside of Activ.
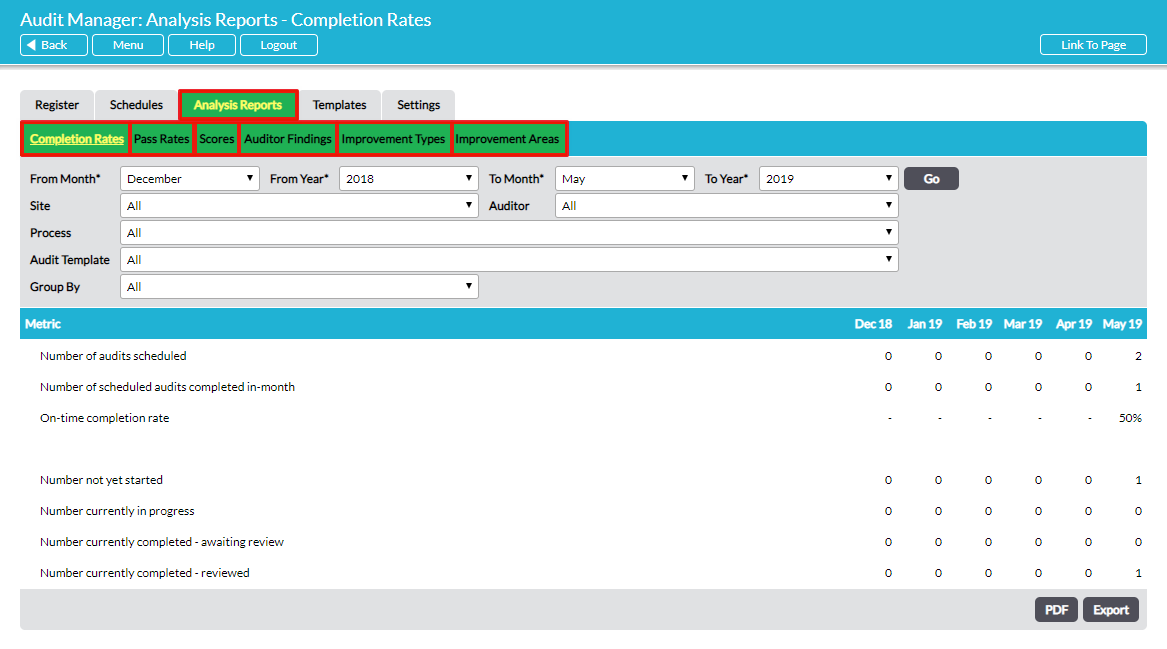
Completion Rates
Reports the in-month completion rate of audits. Specifically, the data reported is:
Number of audits scheduled – for each month, the number of audits scheduled to be conducted during that month.
Number of scheduled audits completed in-month – for each month, the number of audits that were scheduled to be conducted during that month that were completed within the same month. An audit is considered completed at the point at which the review is requested i.e. when its status moves from ‘In Progress’ to ‘Awaiting Review’.
On-time completion rate – for each month, the proportion (%) of scheduled audits that were completed in the same month, calculated as:
On-time completion rate = Number of scheduled audits completed in-month / Number of audits scheduled
Below these three statistics, four supplementary statistics are reported, to give detail on the current status of audits that were scheduled for each month:
Number not yet started – for each month, the number of audits that were scheduled for that month that have not yet been started i.e. are still at the status ‘Scheduled’ today
Number currently in progress – for each month, the number of audits that were scheduled for that month that are still ‘In Progress’ today
Number currently completed – awaiting review – for each month, the number of audits that were scheduled for that month that are at the status ‘Awaiting Review’ today
Number currently completed – reviewed – for each month, the number of audits that were scheduled for that month that are at the status ‘Reviewed’ today
Pass Rates
Reports the pass rate of completed audits. Note that this report covers only audits using ‘scored’ response types (see Audit Manager Settings – Configure Drop-Down Menus in Audit Manager). Specifically, the data reported is:
Number of scored audits completed – for each month, the number of ‘scored’ audits that were completed. An audit is completed at the point at which the review is requested i.e. when its status moves from ‘In Progress’ to ‘Awaiting Review’.
Number of scored audits passed – for each month, the number of ‘scored’ audits that were completed and reached the pass mark.
Scored audit pass rate – for each month, the proportion (%) of completed audits that reached the pass mark, calculated as:
Scored audit pass rate = Number of scored audits passed / Number of scored audits completed
Scores
Reports the average scores of completed audits, for any one (scored) audit template. The audit template is selected in the Template filter field. Specifically, the data reported is:
Number of scored audits completed – for each month, the number of audits that were completed using the specified template. An audit is completed at the point at which the review is requested i.e. when its status moves from ‘In Progress’ to ‘Awaiting Review’.
Average audit score – for each month, the average score of the completed audits (for the specified template).
Average score (as % of maximum) – for each month, the average score of completed audits as a proportion (%) of the total possible score for that template, calculated as:
Average score (as % of maximum) = Average audit score / Maximum audit score
Auditor Findings
For any one response (finding) type, this report gives statistics on the findings recorded by auditors in completed audits. The response type is selected in the Response Type field. The purpose of this report is to allow you to compare findings across your internal audit programme, which may use a number of different audit templates but would typically share the same response type throughout.
For example, you might select the response type “Standard Options” to report on. For this response type, the four possible findings are ‘No issues identified’, ‘Good practice’, ‘Opportunity for improvement’ and ‘Nonconformity’. For each of the four options, the report shows the number of questions in which the auditor selected that response, by month.
See Audit Manager Settings – Configure Drop-Down Menus in Audit Manager for an explanation of Response Types and Options.
Improvement Types
Reports on the number of Improvement Logs raised from completed audits, by Type (category) of improvement log.
Improvement Areas
Reports on the number of Improvement Logs raised from completed audits, by Area (where or what) of improvement log.
