You can analyse your database of incidents in the Incident Log module using Activ’s Reports, Graphs and Frequency Rates tabs. The Reports and Graphs tabs generate statistics on the number of incidents per month. The Frequency Rates tab generates statistics on the frequency rate of reportable accidents and recorded injuries per month. This article deals with Reports and Graphs. See Analysing Incidents – Accident and Injury Frequency Rates for guidance on the Frequency Rates feature.
*****
The Reports tab allows you to generate a report in table form of the number of incidents per month matching your specified criteria. Open the Incident Log module and select the Reports tab. By default, this report will show the number of incidents grouped by Type for the last six months. At the top of the tab are several fields that you can use to specify the report you require.
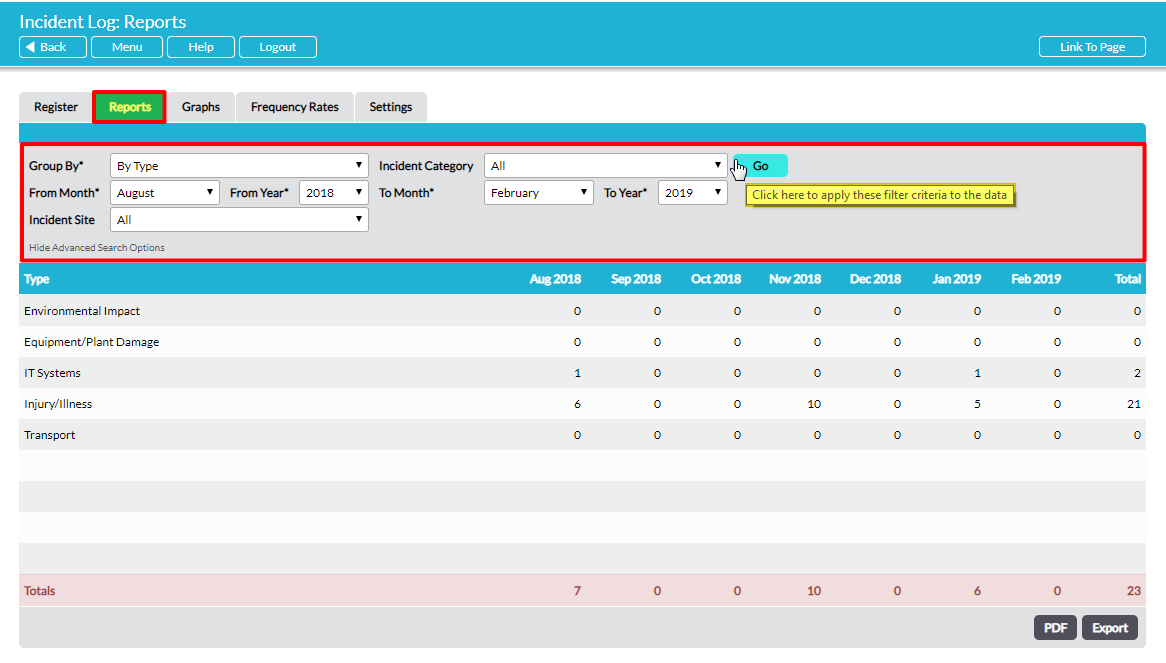
Group By* – select the subject of your report from the drop-down list. You can choose for your report to group incidents by Incident Category, Type, Sub Type, Person Type, Severity, Reportability, Primary Cause, Secondary Cause, Hazard Type, Hazard Source and who the incident was Raised By.
Incident Category – select whether you wish to include Accidents and Near Misses, or only Accidents or only Near Misses in your report.
From Month* and From Year* – select the starting month and year for your reporting period.
To Month* and To Year* – select the final month and year for your reporting period.
Incident Site – (only available if you have enabled Sites via your Incident Log Settings tab). Select the site you wish to report on.
When you have specified your reporting criteria, click on Go and your report will be generated, producing in table form the number of specified incidents in each month and the total.
If required, you can create a PDF of the report by clicking on the PDF button at the bottom right of the screen. You can also export the report data to a CSV file by clicking on the Export button at the bottom right of the screen.
*****
The Graphs tab’s functionality is identical to the Reports tab but produces a graph of the number of incidents per month matching your specified criteria (instead of a table). You can export the graph data to a CSV file by clicking on the Export button at the bottom left of the screen.
